Forgive. Forget.
@mananpsTrader.Asset Manager. Like drawing lines on charts. Dont take life too seriously - We all get stopped out.Not SEBI Regd. Charts for education purposes.
Similar User

@marketshala21

@Abuldeo96

@liveprosoftware

@CraftingSmiles

@chetanvishwasr2

@GhatgeJay
#Nifty Daily. Finally closed above all key #EMA 9/21/50/100/200 Needs to hold for 1 day of consolidation before the next leg of move up. Targets 17.5k/17.7k Supports at 17.2k strong support zone 16.8k #chartswithms #Trade #charts #ichimoku #banknifty

#Nifty #Weekly - Range play going on - both #Tenkan & #Kijun turn straight until either 16747 - 18096 breaks on weekly close. RSI neutral 51.xx #USA #CPI & India Q2 results are next big triggers. Views invited #Ichimoku #Nifty #Banknifty #ChartsWithMS

Nifty - Daily We may come to close this gap in the coming - Strong support zone here. In case this gap is not closed - then I reckon we wont see those lvls again for a long time - Nifty moving to ATH ⬆️ Views invited #ChartsWithMS #Banknifty #Trading #stocks

#nifty - daily - making yet another candle in the shadow of the big breakout candle - this breakout / breakdown will be a big move. RSI 58.xx in neutral zone with +ve bias. #ChartsWithMS #InsideBar #BankNifty #trading

#nifty - 75min - yest expiry candle has defined the range well 17487 - 17695 lets see which side this breaks - this breakout will reward the patient handsomely. RSI slightly -ve at 47 ; a close above 50 will help. #ChartsWithMS #Nifty #Trading #banknifty

#Federal Bank #FedBank - daily - flag formation in play. breakout targets 125-130 - Final target 140. Supports at 109/103. Pattern negated below closing of 100 on daily closing. RSI 63+ #ChartsWithMS #Nifty #Banknifty #Ichimoku #trading

#Nifty lvls to watch 1. 17730 ( we closed above this 2day) 2. gap zone 17650 & 17550 3. 17350 on dy /weekly close #rsi has cooled nicely from 83;not massively overbought here if holds 17650 gap area will be good support for longs. Weekly #rsi 60.xx ⬆️🤞 #ChartsWithMS

#Nifty - daily #Bullish #Engulfing - perfect set up before the #Fed event tonight. Expecting a +ve open & profit booking before #expiry tomo. Supports at 16480/16360 Resistance at 16820/16900 #RSI at 63+ only helps. #ChartsWithMS #Banknifty #trading

#IciciBank - Weekly - seems a potential break out candidate after a long consolidation spell. Will pull #banknifty with it - could potentially touch 900 in the coming weeks. 750/730 are good support lvls. #Ichimoku cloud breakout imminent. #ChartsWithMS #Nifty

#Nifty closed above 200ema/dy-16521 100ema/dy-16436 9ema/Wkly-16204 21ema/Wky-16464 50ema/Wky-16448 16649 is weekly base line - may be the big resistance tomo.Expect some profit booking after 700 pt straight move up. closing of 16550+ is great🐂 #ChartsWithMS #Ichimoku

#nifty weekly-making a small inside bar;firm direction will be determined once it breaks either way. Price has already been rejected firmly at the top of #Ichimoku cloud 16.1k view - can we make another attempt at 16.2k or come to key supports at 15750/15675 ? #ChartsWithMS

#nifty - 75min - 15900 is the last saviour for bulls - if that breaks - could see 15750 as well - reasonable resistance at 16100/16140 lvls. With #USA #CPIInflation data releasing tonight, will be a fun #weekly #expiry tomo #nifty #ChartsWithMS #Banknifty #Ichimoku

#DXY - Weekly - RSI divergence seen - It remains to be seen if we see a pullback or a larger reversal from these lvls. Indicative timeframe - next week - or just before FOMC. Would keep trails on all positional #DXY longs. #ChartsWithMS #Forex #EURUSD #USD #FOMC

#nifty - daily - good support at base line (16k); next big resistance at cloud base ~16450 RSI 55+ ; holding above 50 will help momentum. This is a buy on dip market until we close below 15.5k on weekly close. #ChartswithMS #Nifty #Banknifty #ichimoku #trading

#Nifty - weekly - Making a textbook #Inside Bar candle. A breakout / breakdown of this will see an big move ahead -setting the trend for the next series as well. #ChartsWithMS #Nifty #Ichimoku #banknifty @nity2103

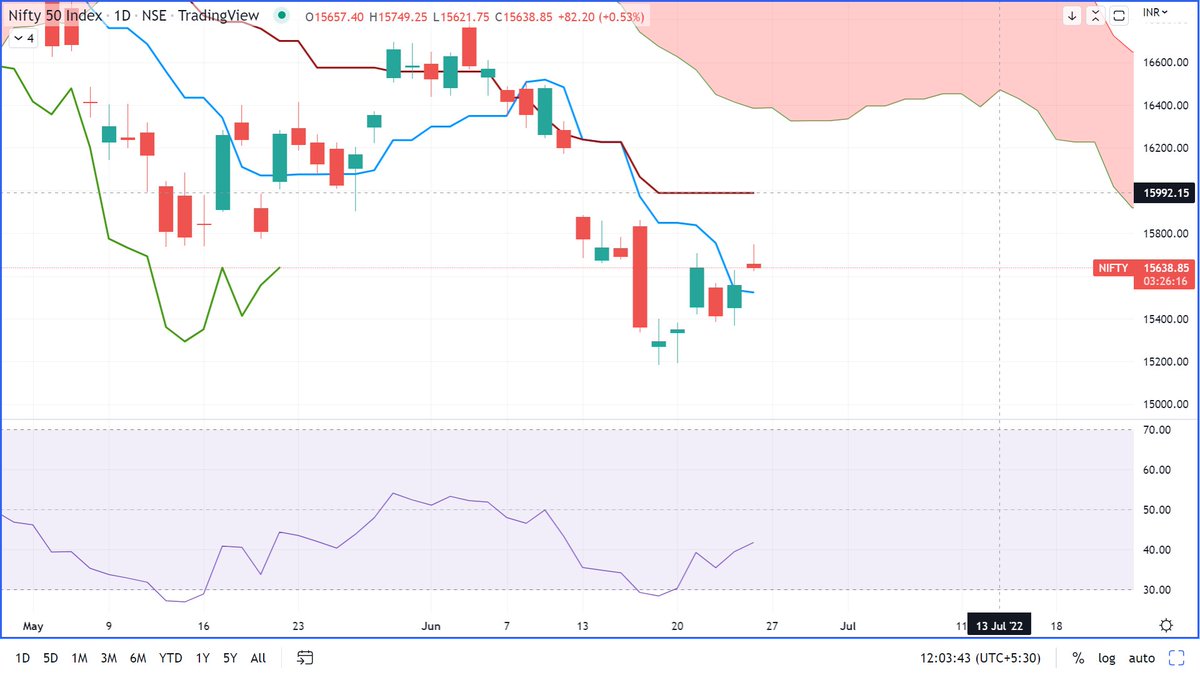
#nifty - Daily #Ichimoku clamp active. Tgt 16k. View negated below 15400 on DCB. #RSI 42 & taking support above 40. #ChartsWithMS

#nifty Weekly: each time its broken 100 ema/weekly its taken major support only around 200 ema/weekly All bounces are just that-bounces-and should be used to exit/reduce trading longs & add trading shorts 1st big hurdle 15462 (100 dema/weekly) #ChartsWithMS #Nifty #ichimoku

#Nifty Daily - base line turning flat (16556) - will stay flat for 5 days. this could be short term pivot & good support point +-50 pts. RSI 50+ is positive. #Ichimoku #Nifty #Banknifty #ChartsWithMS

#nifty 75min. If the high of today doesn't breach (16695.xx) - We will see the base line go straight for a long time(15 bars) at 16300. this acted as a good base at 16067. will be an interesting expiry(2/6) good PE writing at even ATM Strikes (PCR 1.42+) #ichimoku #chartswithMS

Just fed up of seeing shit-posting on technical charts. All I see is incorrect trendlines, wrong candle patterns,📐 which show geometry was skipped in school, n famous H&S which is inexistent I will start with basic TA education, 1 concept everyday. Later please do it properly🙏
United States Trends
- 1. #OnlyKash 57,1 B posts
- 2. Starship 194 B posts
- 3. Sweeney 11,8 B posts
- 4. Jaguar 61,4 B posts
- 5. Nancy Mace 87,2 B posts
- 6. Jim Montgomery 4.059 posts
- 7. Medicare and Medicaid 24,2 B posts
- 8. Jose Siri 2.851 posts
- 9. $MCADE 1.347 posts
- 10. Dr. Phil 8.474 posts
- 11. Monty 11,3 B posts
- 12. Linda McMahon 3.019 posts
- 13. Dr. Mehmet Oz 7.732 posts
- 14. Bader 4.274 posts
- 15. #LightningStrikes N/A
- 16. Joe Douglas 12,4 B posts
- 17. Cenk 14,5 B posts
- 18. Lichtman 1.023 posts
- 19. $GARY 1.915 posts
- 20. Enner 3.914 posts
Something went wrong.
Something went wrong.


