R CODER
@RCoderWebLearn R! #rstats #rstatsES FB: https://t.co/xZ7Ximoj9k También en español 😉 🔗 https://t.co/ympcDHTcOS 🔗 https://t.co/xfoOwM3EA2 🔗 https://t.co/IZmRkHEvZg
Similar User

@easystats4u

@rmarkdown

@RConsortium

@_R_Foundation

@DataSciencetut

@icymi_r

@JoachimSchork

@LatinR_Conf

@mdancho84

@thinkR_fr

@CedScherer

@dvaughan32

@gt_package
🎉🚀 Introducing R-PACKAGES.IO 🚀🎉 Discover & Explore R Packages, Functions, and Datasets like never before! 🌟 ✨ 20k+ Packages ✨ 400k+ Functions ✨ 40k+ Datasets The ultimate resource for R developers! 📊🔍 🔗 r-packages.io #RStats
{ggResidpanel}: R package for creating panels of diagnostic plots for a model using ggplot2 and interactive versions of the plots using plotly 📈📊 🔗 r-packages.io/packages/ggRes…

🚨 Essential R Functions for User Notifications 🚨 Need to alert users about key events in your code? ℹ️ message(): Deliver non-critical info ⚠️ warning(): Flag potential issues but let the code continue 🛑 stop(): Halt execution for critical errors 🔗r-coder.com/warning-error-…

🤯 Hypothesis testing in R 🪧 🔗 r-coder.com/r-statistics/h… ✅ Normality tests: Shapiro test and Lilliefors ✅Goodness of fit: Chi-squared and Ks test ✅Tests for the median: Wilcoxon, Mann-Whitney and Kruskal-Wallis ✅ Tests to compare means, F-test, test for proportions


[R CHARTS] 📊📈 Featuring over 1400 R plots with reproducible code! 🥳 🔗 r-charts.com/ggplot2/ #Rstats #ggplot2


📦 {swirl}: Learn R, in R {swirl} teaches you R programming and data science interactively, at your own pace, and right in the R console! 🤓 🔗 r-packages.io/packages/swirl 🔗 swirlstats.com

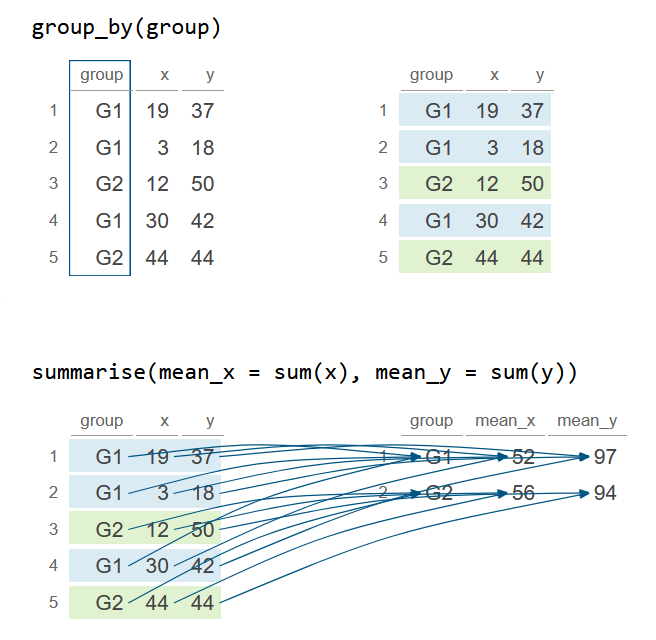
Create statistical summaries in R with the summarise() function from dplyr 🔗 👉 buff.ly/47wvDZf via @RCoderWeb #RStats #DataWrangling #DataCleaning #DataScience #DataAnalytics #Stats #DataViz #dplyr
Create statistical summaries in R with the summarise() function from dplyr 📌 r-coder.com/summarise-dply…

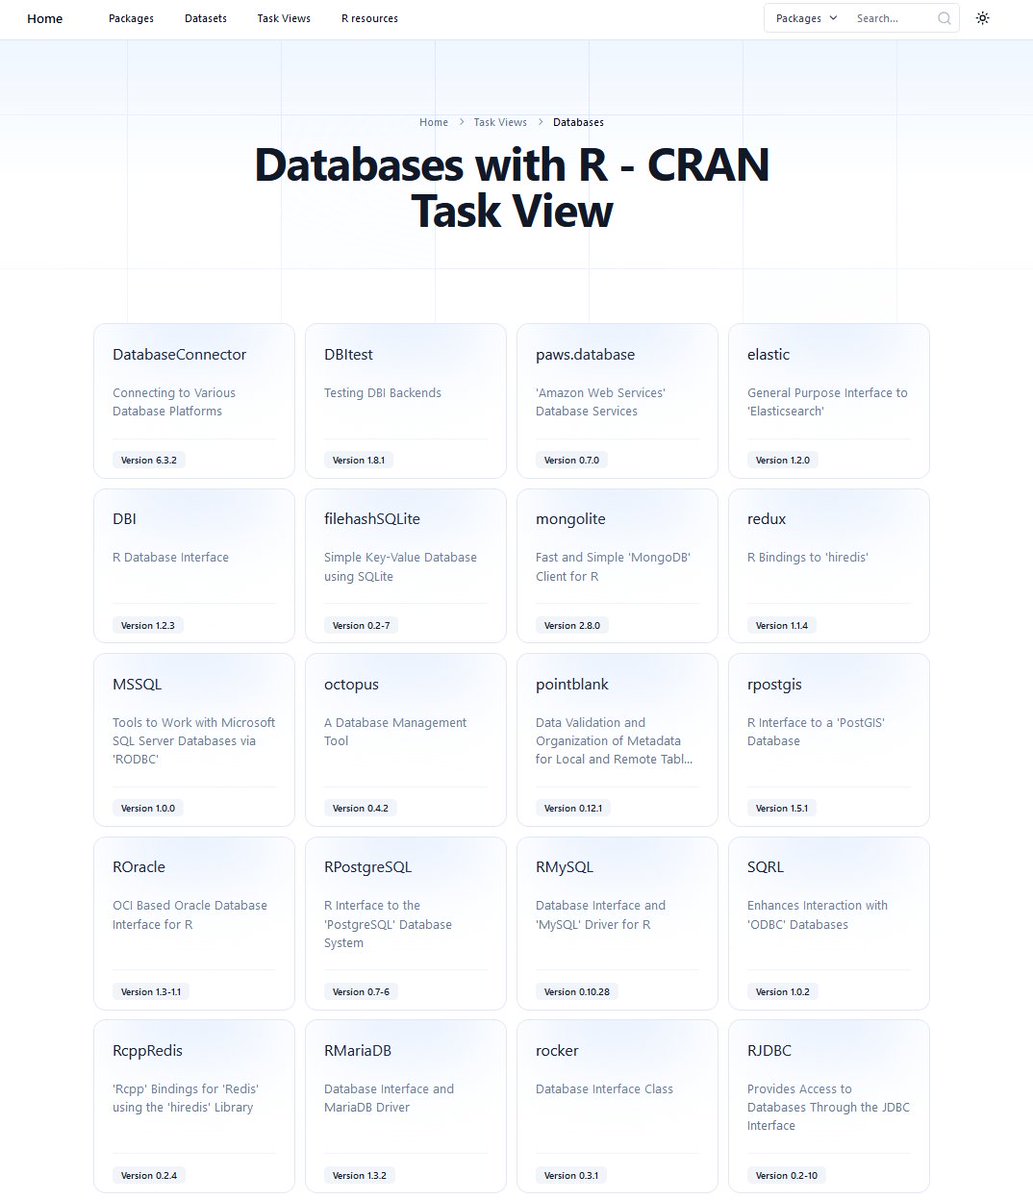
How can I find #Rstats packages related to a specific topic? 🤔 👇👇 r-packages.io/task-views

Do you want to try matplotlib or seaborn? 📊 #python #matplotlib #seaborn 👉 python-charts.com
New go-to website for R packages documentation.
{Quarto}: convert #R Markdown documents and Jupyter notebooks to a variety of output formats 🔗 r-packages.io/packages/quarto Authors: JJ Allaire and Christophe Dervieux

United States Trends
- 1. #PaulTyson 143 B posts
- 2. #SmackDown 42,3 B posts
- 3. Barrios 26,1 B posts
- 4. Rosie Perez 3.005 posts
- 5. Goyat 18 B posts
- 6. #NetflixFight 1.598 posts
- 7. Evander Holyfield 2.534 posts
- 8. #netfilx 1.377 posts
- 9. #NetflixBoxing 1.050 posts
- 10. Shinsuke 3.150 posts
- 11. Bronson Reed 3.251 posts
- 12. Cedric 6.846 posts
- 13. Purdue 6.856 posts
- 14. Lennox Lewis 1.227 posts
- 15. Bayley 5.632 posts
- 16. My Netflix 10,6 B posts
- 17. Cam Thomas 2.696 posts
- 18. Grok 49,3 B posts
- 19. B-Fab 4.745 posts
- 20. LA Knight 4.859 posts
Who to follow
-
 easystats
@easystats4u -
 R Markdown
@rmarkdown -
 R Consortium
@RConsortium -
 The R Foundation @[email protected]
@_R_Foundation -
 Data Science Tutorials
@DataSciencetut -
 R posts on blaze.email
@icymi_r -
 Joachim Schork
@JoachimSchork -
 LatinR
@LatinR_Conf -
 🔥 Matt Dancho (Business Science) 🔥
@mdancho84 -
 ThinkR
@thinkR_fr -
 Cédric Scherer
@CedScherer -
 Davis Vaughan
@dvaughan32 -
 The {gt}/great_tables Packages
@gt_package
Something went wrong.
Something went wrong.


