MULawPoll
@MULawPollNonpartisan, public, transparent polls on Wisconsin policy & politics since 2012. National polls on the Supreme Court etc since 2019. Directed by @PollsAndVotes
Similar User

@DanielBice

@WisconsinEye

@sbauerAP

@WisVoter

@wispolitics

@MollyBeck

@SaintAnselmPoll

@WI_Elections

@WisDOJ

@patrickdmarley

@MikeGousha

@PollsAndVotes

@PolitiFactWisc

@jessieopie

@jrrosswrites
The story in WI wasn't "red wave". It had smallest GOP swing almost anywhere, and was closest state. To me, the broader story is a historically unprecedented period of partisan parity in a WI electorate that barely budges from its 50/50 baseline. More: bit.ly/3Az0oRv
In a year when turnout fell nationally, it grew in Wisconsin. Just as Trump's increase wasn't concentrated in any particular part of the state, neither was the increase in turnout. Better population data will come later, but here's what we know now.

We missed the presidential by 1.9 points and the Senate by 1.1 points. Our long term average absolute error is 2.1 points. Our average error on the margin is -0.5, meaning half a percent too Democratic. We have been too Republican in 8 elections & too Democratic in 8 elections.

Keeps things interesting here.
How close was Wisconsin? Closest of all the states. Now 5 of last 7 presidential elections with <1% margin.

my look at WI's split outcome (Trump/Baldwin victories). No, there werent a lot of Trump-Baldwin voters. But she outperformed Harris the most in places Trump won or made his biggest gains in '24, incl. small counties in north and west and blue-collar wards bit.ly/3AL18CW
How the vote shifted in the Madison area from 2020 to 2024. Data and map by @MULawLubar fellow John Johnson, @jdjmke Interactive map at law.marquette.edu/assets/communi…

great analysis and resource by my colleague @jdjmke of Pres and Sen voting trends in WI using ward/ census data showing where Trump improved by education, race, pop density etc including growing educ gap, and Trump rise in majority Latino wards
My first look at the 2024 election in Wisconsin is based on a custom ward file I put together for (almost) the entire state. You can view that here. (Mobile users beware, this is meant for desktop viewing) law.marquette.edu/assets/communi…

Fine analysis of Wisconsin vote by my @MULawLubar colleague John Johnson, @jdjmke read his full post at law.marquette.edu/facultyblog/20…
How did Wisconsin vote shift from 2020 to 2024? @MULawLubar colleague John Johnson has that. What types of people voted for whom, how that has changed, and how did the Senate vote differ from presidential vote? Great analysis & interactive ward map. law.marquette.edu/facultyblog/20…

after all the discussion of the impact of the 3rd party vote, even in WI, where RFK stayed on ballot, total 3rd party vote in running around 1.5%, which is less than 2020, and a lot less than 2016
First fruit of the @MULawLubar project by John Johnson. Collecting ward level data for Wisconsin tonight. Many plots to come.
An early look at the first Waukesha county wards to report.

The guy actually doing all the work.
Here's a live map I'm updating of Wisconsin ward returns as they come in. Hover over a ward to see how it voted this time, vs 2020 and 2016. jdjohn215.github.io/wisc-election-…
He gets the popcorn while I do all the work tonight.
Thanks Ben. The tool is for all to use. Table of contents on the left expands to every county. mulawpoll.org/county-overvie… and municipalities at mulawpoll.org/municipalities… All the credit is due to John Johnson @jdjmke
Pro tip for folks preparing to monitor local returns on Election Night: the good folks at @mulawpoll created a tool that lets you instantly pull up election results by municipality going back to 2000. It's wildly helpful.

He keeps using my data….
The gender gap rightly gets lots of attention. In @MULawPoll men are +12 for Trump, women +14 for Harris in Wisc. But other demographic group gaps are larger and deserve attention. Most extreme is born-again vs no religion. But see city vs rural, 18-29 vs 45-59. And groups 50-50.

How someone is using their “fall back” hour.
Wisconsin voter registration. There is an election year cycle that peaks after Election Day. As of Nov. 1 there are 3,658,236 active registered voters. On Nov. 1 2020 there were 3,684,726. Typically about 100,000 more register on Election Day, so expect about 3.75-3.8M in end.

That would be “OUR last @MULawPoll” buddy.
The simple gender gap in my last @MULawPoll is women 14 points for Harris, men 12 points for Trump, a 26 point gap. But note women are more for Harris than men in *every* demographic except rural & small town. Read down, smallest gap at top, largest at bottom.
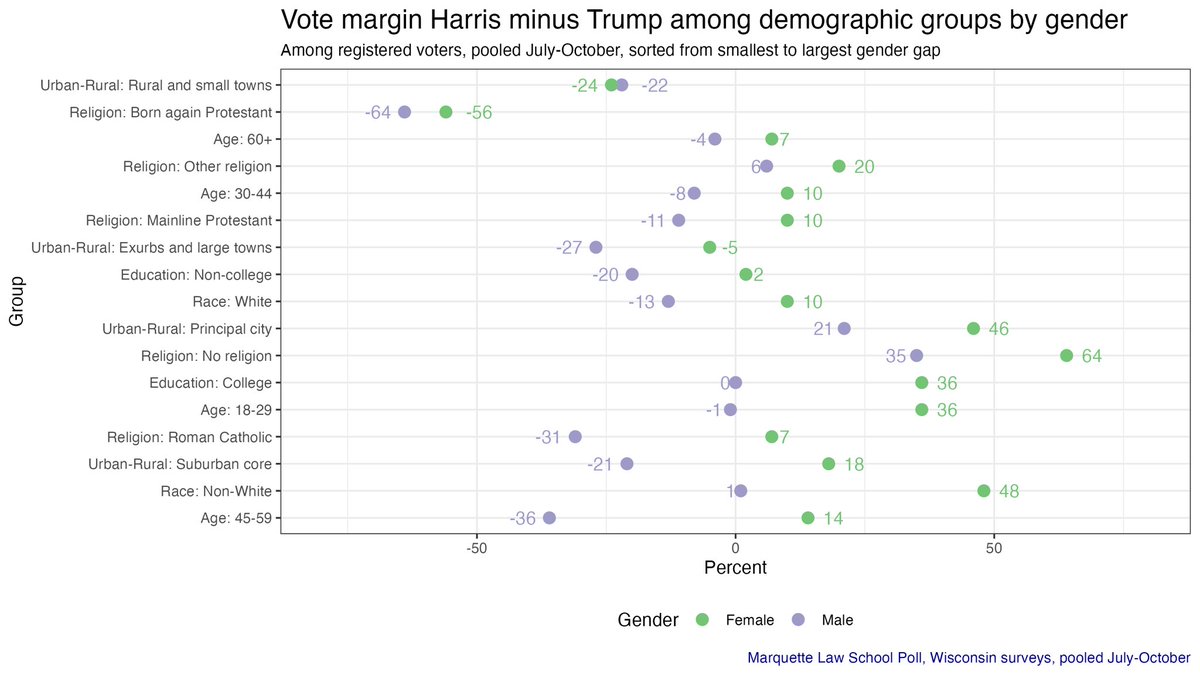
these are the demographic splits in WI in pres race (if you have good eyesight), pooling the last 4 Marquette polls since summer per @PollsAndVotes with biggest Trump edge at top and biggest Harris edge at bottom and evenly divided groups in middle

United States Trends
- 1. $MAYO 10,2 B posts
- 2. Tyson 393 B posts
- 3. Pence 44,7 B posts
- 4. Dora 22,5 B posts
- 5. Laken Riley 40,5 B posts
- 6. Ticketmaster 16,8 B posts
- 7. Kash 73,3 B posts
- 8. Mike Rogers 8.922 posts
- 9. #LetsBONK 6.336 posts
- 10. Pirates 19 B posts
- 11. Cenk 11 B posts
- 12. Debbie 16,9 B posts
- 13. #FursuitFriday 15,6 B posts
- 14. Iron Mike 16,3 B posts
- 15. Mr. Mayonnaise 1.408 posts
- 16. The UK 428 B posts
- 17. Gabrielle Union N/A
- 18. Fauci 176 B posts
- 19. Scholars 10,8 B posts
- 20. Oscars 14 B posts
Who to follow
-
 Daniel Bice
@DanielBice -
 WisconsinEye
@WisconsinEye -
 Scott Bauer
@sbauerAP -
 Craig Gilbert
@WisVoter -
 WisPolitics.com (State Affairs Pro Wisconsin)
@wispolitics -
 Molly Beck
@MollyBeck -
 Saint Anselm Poll
@SaintAnselmPoll -
 Wisconsin Elections
@WI_Elections -
 Attorney General Josh Kaul
@WisDOJ -
 Patrick Marley
@patrickdmarley -
 Mike Gousha
@MikeGousha -
 Charles Franklin
@PollsAndVotes -
 PolitiFact Wisconsin
@PolitiFactWisc -
 Jessie Opoien
@jessieopie -
 JR Ross
@jrrosswrites
Something went wrong.
Something went wrong.


