Jude Raji
@JudeRaji_Microsoft Certified Power BI Data Analyst Associate || https://t.co/YVqDetFGW1 || My blog: https://t.co/FVTE55d7MB
Similar User

@CiciTiwa

@BalogunIsa40659

@Mayorofillesha

@jenkf_

@ademolaaa__

@akpati_chidinma

@Big_vic1_

@hyperozai

@jexie_jeff

@ninsiimasyl

@agricpikin

@omisadeemmex

@Psycho_Ebube

@Tom_dopezzy

@Dhameelarey
I did a thing with the @EASPORTSFC FC24 dataset. - Power BI for Analysis and Visualization. - Figma for Dashboard Background. Check it out: tinyurl.com/jude-raji-eafc…


Niiiiiiiiice.
Hi #Datafam I had fun recreating @gbolahaann call center dashboard learning and exploring tableau concept link to viz :public.tableau.com/views/CallCent…

I'm excited to share that I will be Leading a 9-week Data Analytics training at The Faith Miracle Center (starts in 2 weeks!). Where I will be sharing my expertise and experiences. Feel free to register using the link 👇 bit.ly/FreeEmpowermen… #DataScience #Training

I got the chance to sit down with @gbolahaann to talk through how he's continuously improving his tableau skills, found his niche in business dashboards, and wants to pay forward his learnings through the @LagosTUG📊 cj-mayes.com/2024/11/13/bus…
You (and your team) did great. Well-done!
Excited to share my team’s journey tackling a moniepoint bankstatement project in our #WittigMentorship program. Using power query for ETL, SQL for analysis and looker for Visualization, we transformed raw pdf data into actionable insights. A THREAD!

Once I see inconsistent spacing, I can’t un-see it. It’s as if it stands out and it is very distracting. The full video is spot on!
A mistake to Avoid in Report Design! Watch the full video on my YouTube Channel (Link in the comments) Follow me for more Power BI tips 🚀 #powerbi #report #design #analytics
Hi #datafam! 🌳 For my next submission in @LagosTUG 's bootcamp, I created a survey response dashboard, inspired by @KhennieNectar I used a dataset with absolutely no numeric data to derive insights! Explore the dashboard in both light and dark modes: public.tableau.com/views/Eco-frie…


What’s going on #datafam! Let’s talk about Data Cleaning in #SQL. When last have you tried to clean data using sql? #Data #cleaning in SQL involves identifying and correcting errors or inconsistencies in data to improve its quality and accuracy. Thread🧵
5 Tips to Instantly Boost Your UX/UI Thread: 🧵

“Data is Funny” 😭😭😭😭😭😭😭😭😭😭😭
Data is Fun Data is Funny Data is Interesting But Data will make you CRY 😭
All set!

It’s almost that time of the year when all ginger will be lost and you just want to eat chicken and hangout and travel to the village 😂 So before we get to that point, let’s have a data challenge for 2weeks. I will drop a dataset and we will turn it into a portfolio project…
So simple, yet so rich.
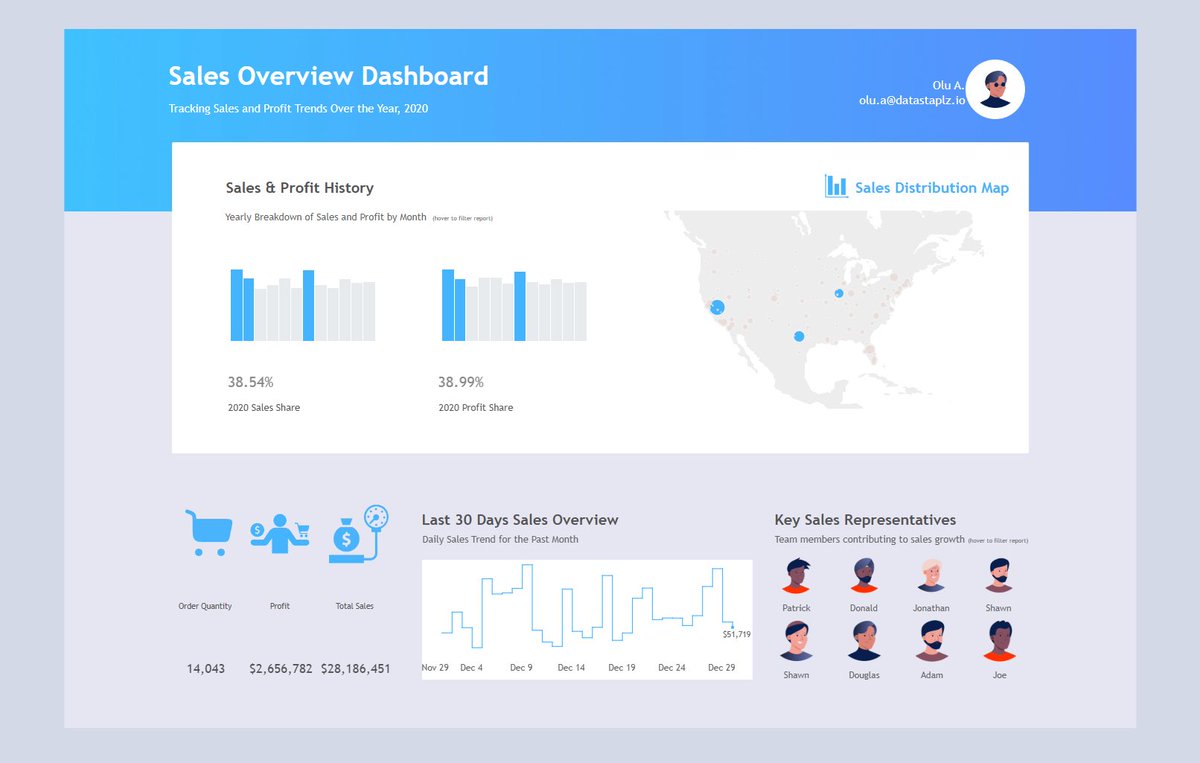
🚀 Just completed a 2020 Sales Overview Dashboard! Highlights 📊 Sales & profit trends (top 3 months) 🗺️ Sales map (top 3 states & counties) 👥 Key sales reps & KPIs ✨ Interactive hover for insights #DataViz #Tableau #SalesAnalytics tinyurl.com/3jvvr629 via @tableaupublic


Ask ChatGPT “based on what you know about me. draw a picture of what you think my current life looks like” past your responses below. thanks again @mreflow & @danshipper
🤣🤣🤣 I’m sorry. I can’t stop. This kitchen must burn to the ground.
Be careful of outliers skewing your data. Illusion: "Our average customer spends $1000!" Reality: One customer spent $100,000, the rest spent about $10.
Created with @msexcel dynamic Dashboard to report Nigeria's Cash crops product exports. Big thanks to @iam_daniiell for the initial inspiration. #TDI #Trump2024


Boss🙌🙌🙌
I just finished a Power BI project analyzing a Pharmacy's sales data! Used it as an opportunity to create a calendar dashboard. Full story on Medium: tinyurl.com/yjmaabbh Dashboard link: shorturl.at/RKt4L Tools used: @msexcel & @MSPowerBI


Big Ups😌😌
I just finished a Power BI project analyzing a Pharmacy's sales data! Used it as an opportunity to create a calendar dashboard. Full story on Medium: tinyurl.com/yjmaabbh Dashboard link: shorturl.at/RKt4L Tools used: @msexcel & @MSPowerBI


Boss of visuals
I just finished a Power BI project analyzing a Pharmacy's sales data! Used it as an opportunity to create a calendar dashboard. Full story on Medium: tinyurl.com/yjmaabbh Dashboard link: shorturl.at/RKt4L Tools used: @msexcel & @MSPowerBI


I just finished a Power BI project analyzing a Pharmacy's sales data! Used it as an opportunity to create a calendar dashboard. Full story on Medium: tinyurl.com/yjmaabbh Dashboard link: shorturl.at/RKt4L Tools used: @msexcel & @MSPowerBI


United States Trends
- 1. Justin Tucker 14,2 B posts
- 2. Ravens 43,1 B posts
- 3. Steelers 45,7 B posts
- 4. Packers 26,3 B posts
- 5. Bears 65,1 B posts
- 6. $CUTO 8.720 posts
- 7. Drake Maye 5.902 posts
- 8. Jordan Love 4.286 posts
- 9. Aaron Rodgers 3.039 posts
- 10. #OnePride 7.367 posts
- 11. #HereWeGo 7.336 posts
- 12. McDonald 71,8 B posts
- 13. Gibbs 6.862 posts
- 14. Browns 18,1 B posts
- 15. Taysom Hill 1.927 posts
- 16. Titans 28,6 B posts
- 17. #GoPackGo 3.477 posts
- 18. #Jets 3.841 posts
- 19. #BALvsPIT 2.900 posts
- 20. Derrick Henry 3.079 posts
Who to follow
-
 Cici Tiwa Writes ✍️✨
@CiciTiwa -
 Balogun Isaac Junior
@BalogunIsa40659 -
 Mayor of Ilesha
@Mayorofillesha -
 jen
jen
@jenkf_ -
 DEmolA.🦅
@ademolaaa__ -
 Nma💗💖💕
@akpati_chidinma -
 Victor 🍄
@Big_vic1_ -
 Poseidon🔱👑
@hyperozai -
 620huncho
@jexie_jeff -
 Sylvia Ninsiima
@ninsiimasyl -
 Abodunrin Lukman Olawale
@agricpikin -
 Emmex⚡
@omisadeemmex -
 Eri¢
Eri¢
@Psycho_Ebube -
 DOPEZZY
@Tom_dopezzy -
 Damilare Raimi
@Dhameelarey
Something went wrong.
Something went wrong.


