Zhu, Gengping
@Gengping_insect niche and distribution modeling, functional insect, biodiversity and conservation, biological invasion, global change
Similar User

@Marlon_E_Cobos

@ArthropodAbbey

@saumbios

@DowenJocson

@JavierGIllan1

@LP_Campbell
The 8 best resources on time series forecasting with Python. 🧵 (Number 3 is the best)

我惊讶于很少有人在手机上使用 AI。 因为它能让你在更少的时间内完成更多的工作。 以下是在手机上使用 AI 的 8 种方式(免费):

The ggplot2 package has become so popular over the years that there are now over 100 extension packages specifically designed to enhance ggplot2 visualizations. These extensions make the ggplot2 syntax even more efficient and help create stunning graphs with ease. In the…

My favorite R package for ultra-fast exploratory analysis:

The Number 1 Skill that helped me grow my data science career? Time Series Forecasting. Here's 2 years of help in 2 minutes:

Rules of color in Data Visualization

To be a good geospatial data scientist, you need good tools. My tool of choice is R. Here are the packages I can't live without: #rstats

The Department of Entomology at Texas A&M University has a position available for a Tenured: Associate Professor/Professor, Endowed Chair in Urban and Structural Entomology. See position details and apply here: tx.ag/EmploymentOppo… #TAMUBugs

I'm so excited to announce that my department is now hiring TWO ECOLOGISTS at the Assistant Professor Level. We will be really excited to substantially expand research in ecology in our EEOB Department at UCR. Please RT aprecruit.ucr.edu/JPF01983
R is wild for network analysis. Case in point: ggraph. 8 crazy examples (Number 8 is my favorite):
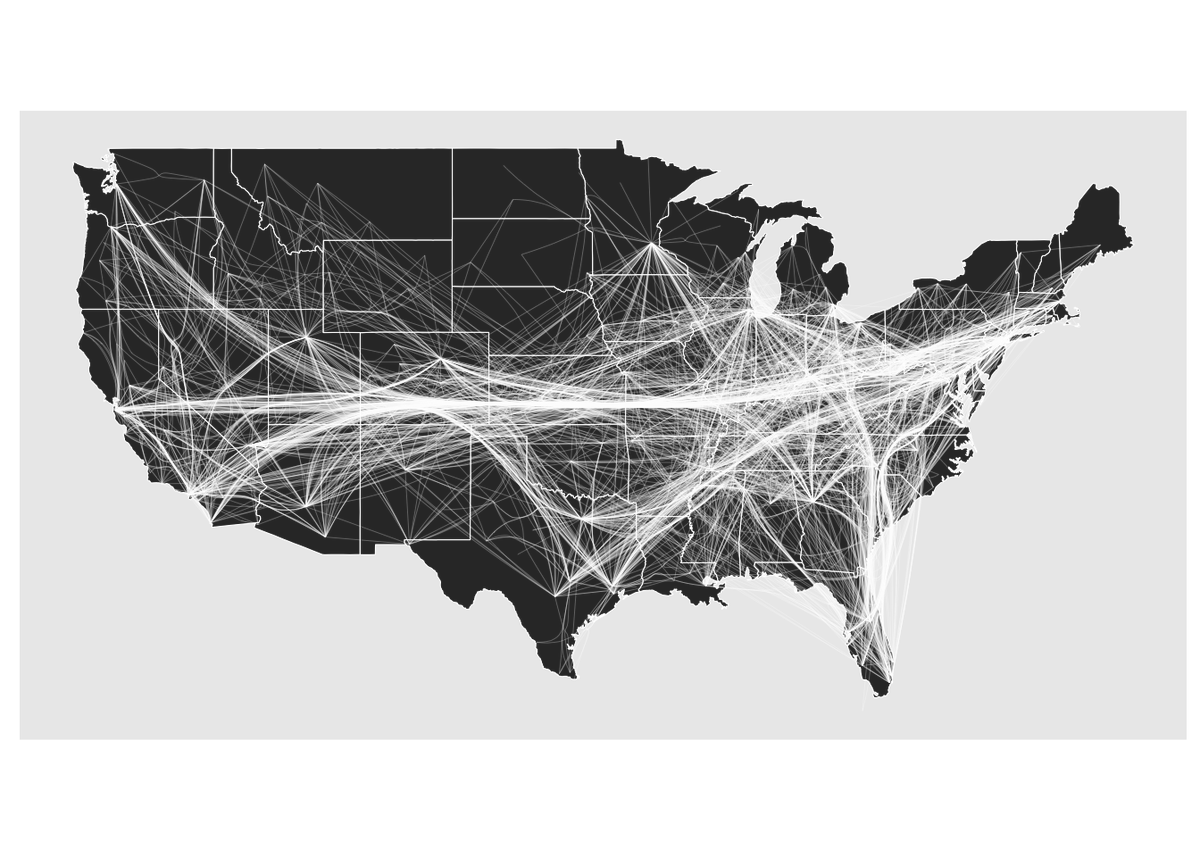
The ggmulti package is an extension for ggplot2 that allows you to combine multiple visualizations into a single plot. It simplifies the process of overlaying different types of graphs, such as scatter plots, line graphs, and histograms, to compare multiple data sets at once. ✔️…

This new R package is wild. It's called ggalign. Here's what it can do:

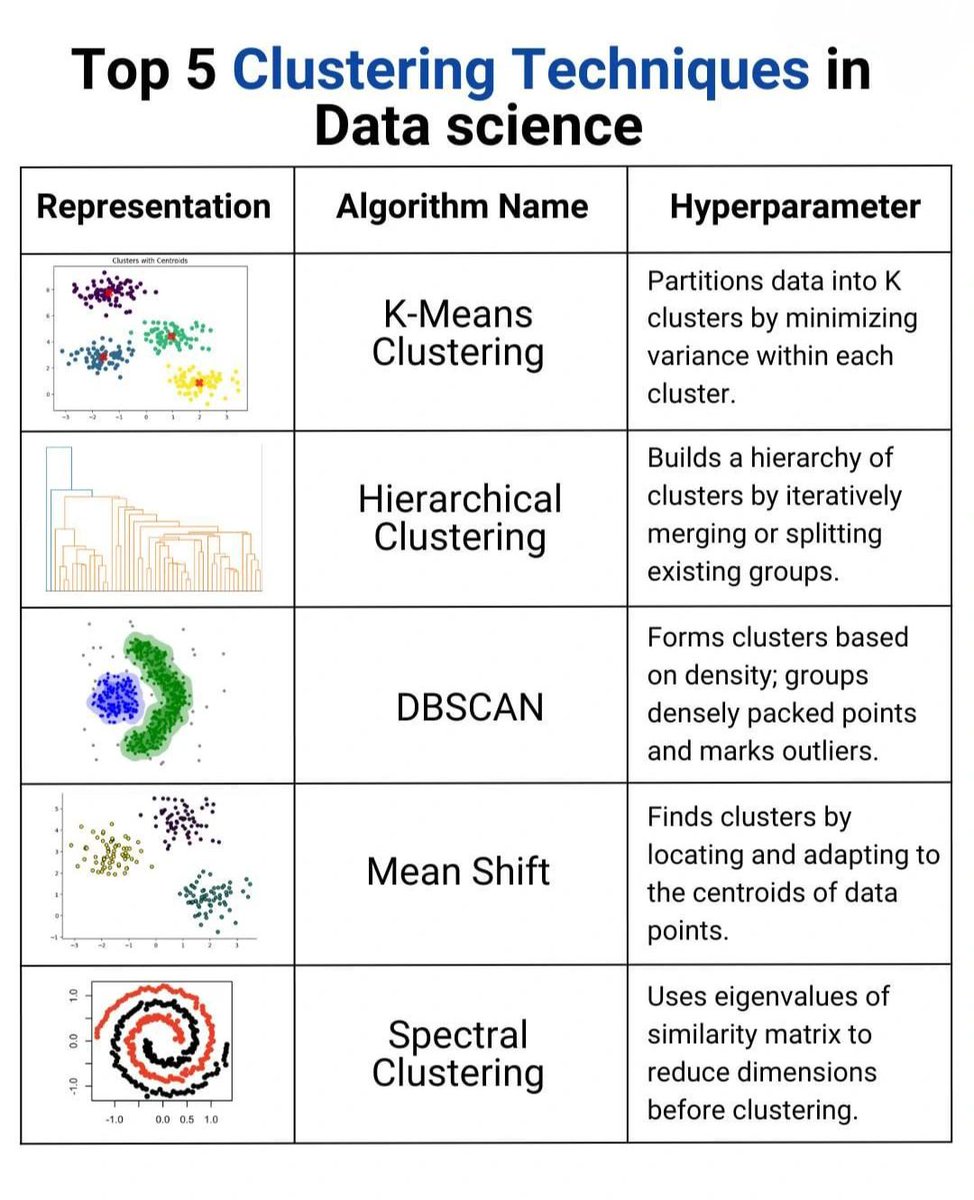
Leverage the power of clustering techniques to uncover patterns and group similar data points based on their features, revealing hidden insights in your data! In a recent discussion, important clustering methods and their applications were highlighted. Here’s a brief overview of…
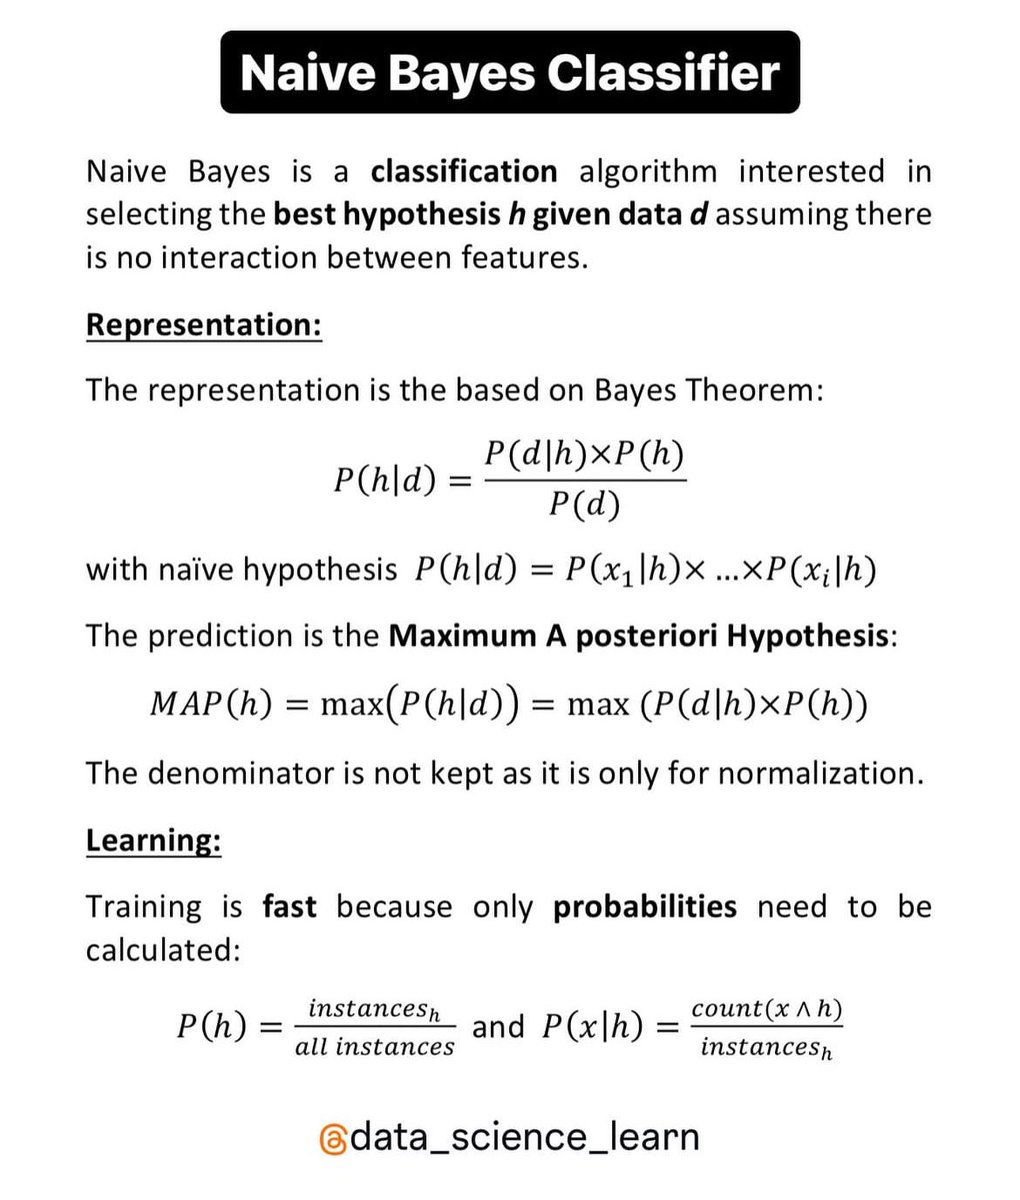
Regression outputs contain many different components, each providing crucial insights into the effectiveness and characteristics of the model. The detailed explanation below will help you understand the various parts of the regression model output provided by R. From the formula…

ggstatsplot : an R 📦 that is an extension of ggplot2 and creates stunning, publication-ready visualizations with integrated statistical tests 📈 indrajeetpatil.github.io/ggstatsplot/in… #DataScience #Stats #DataAnalysis #DataViz #ggplot2

听说这玩意特斯拉刚有?👇
35 most useful tools for PhD students and researchers. Literature Review 1. @LitmapsApp 2. @R_Discovery 3. @Scite 4. @ConnectedPapers 5. @ResearchPal_AI 6. Journal Finder Paper Writing 1. @teampaperpal 2. @thetrinkaai 3. @Grammarly 4. @scispace_ 5. @overleaf 6.…

Stop using box plots. Use this plot instead. Here's why:

Sometimes linear regression is just not a good fit for your data! Especially if the relationship between variables isn't linear or if there is high variability in your data sets, it might be time to explore alternative approaches: ✅ Polynomial Regression: Useful when the…

United States Trends
- 1. McDonald 61,3 B posts
- 2. $CUTO 6.859 posts
- 3. Packers 11,4 B posts
- 4. Clark Kent 2.644 posts
- 5. #RollWithUs 2.311 posts
- 6. #AskFFT 1.503 posts
- 7. Coke 37,5 B posts
- 8. Mike Johnson 61,7 B posts
- 9. DeFi 102 B posts
- 10. Tillman 2.839 posts
- 11. Go Bills 6.490 posts
- 12. #GoPackGo 1.530 posts
- 13. Big Mac 7.897 posts
- 14. Full PPR N/A
- 15. #AskZB N/A
- 16. #sundayvibes 9.880 posts
- 17. HFCS N/A
- 18. Good Sunday 79,6 B posts
- 19. Chubb 1.725 posts
- 20. Jennings 5.693 posts
Something went wrong.
Something went wrong.




![She/her.
Insect enthusiast. Science lover. #mosquitoes #odonates [Personal/professional account: opinions are my own; RTs are not endorsements]](https://pbs.twimg.com/profile_images/1510674769233866754/eocpWEtl.jpg)

