🛰
@Edgar_V1lleda| Biología | Ecología del paisaje | percepción remota | SIG | fractalidad | cómics| bicicleta | leer | videojuegos | cocinar |
Similar User

@mariatteMx

@TithoTed

@Biohard

@fabiors777

@RallyBadajoz70

@TamaraContador

@diosesdp

@ecoyaab

@StregaBettina

@TipsmejorarDF

@Nic_Fam

@AlexThunderlord
Have you been enjoying our introductory webinar series on SAR?🛰️🌎 If you want to learn more, you can dive even deeper into SAR data and applications on the new Earthdata website!
Looking for data recipes and tutorials to help you learn how to work with synthetic aperture radar (#SAR) data? Check out the learning resources from our NASA Alaska Satellite Facility SAR data center on the new Earthdata website. View tutorials: go.nasa.gov/3O9uQ7O

🌲🌲 Point2Tree(P2T)—Framework for Parameter Tuning of Semantic and Instance #Segmentation Used with Mobile Laser Scanning Data in #Coniferous #Forest 🌲🌲 ✍️ Maciej Wielgosz et al. 🔗 brnw.ch/21wOHJF

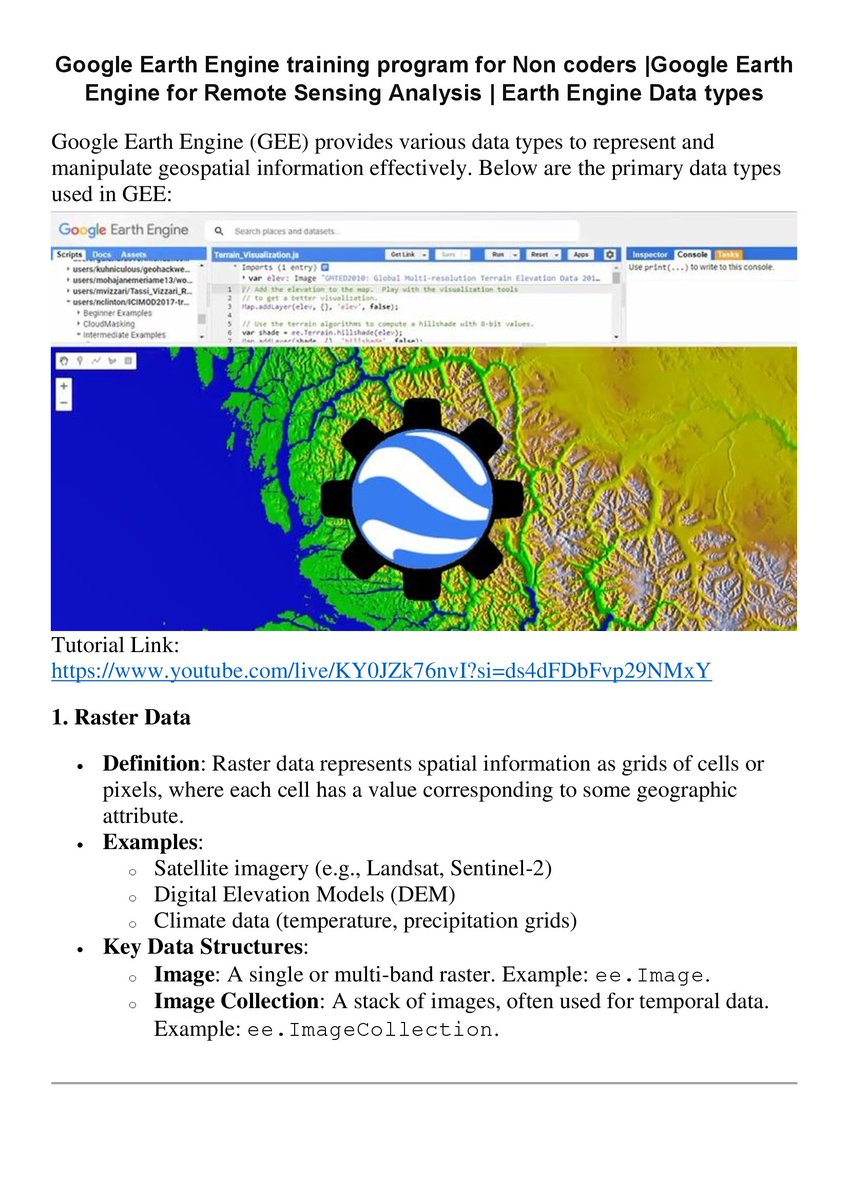
Google Earth Engine training program for Non-coders |Google Earth Engine for Remote Sensing Analysis | Earth Engine Data types Tutorial Link: youtube.com/live/KY0JZk76n… Registration Info: studyhacksgeospatial.com/google-earth-e… #googleearthengine #remotesensing


Looking for data recipes and tutorials to help you learn how to work with synthetic aperture radar (#SAR) data? Check out the learning resources from our NASA Alaska Satellite Facility SAR data center on the new Earthdata website. View tutorials: go.nasa.gov/3O9uQ7O

La neta los que hicieron esto se rifaron, una chingoneria de maqueta.
Awesome tutorial on using the Landsat Explorer app. Compare surface temperature vs moisture vs vegetation. Identify healthy or dry vegetation. Animate over time or run on-the-fly change detection. All from your browser! ow.ly/7sYk50U2OmU

Descargar datos históricos diarios de precipitación y temperatura de casi cualquier lugar del mundo acolita.com
“Remember, Remember the 5th of November” V for Vendetta (2005)
With launch coming soon, spruce up your @CopernicusEU #Sentinel1C knowledge with our info package! esamultimedia.esa.int/docs/EarthObse…

🛰️🖼️ Hybrid Attention-Based Encoder–Decoder Fully #Convolutional Network for #PolSAR Image #Classification ✍️ Zheng Fang et al. 🔗 mdpi.com/2072-4292/15/2…

🌍 Deep Learning meets #GIS: Revolutionizing how we analyze #spatial data. From #smart cities to precision #agriculture, #GeoAI is transforming #geospatial intelligence. Learn more ⬇️ shorturl.at/wzXPM #AI #MachineLearning

SegmentAnyTree: A sensor and platform agnostic deep learning model for tree segmentation using laser scanning data 🌳
🌎Visualizing the Agricultural Field Boundary dataset - Fields of The World (FTW, fieldsofthe.world) - using #leafmap on @py_cafe ☕️ Check it out: py.cafe/giswqs/leafmap… @opencholmes
Try FTW! fieldsofthe.world We just did a chunk of work to make it easier to run, output geoparquet/fiboa, and even train your own models. Would be awesome for it to be part of your journey, to teach it, and see if there’s ways to bring into leafmap.
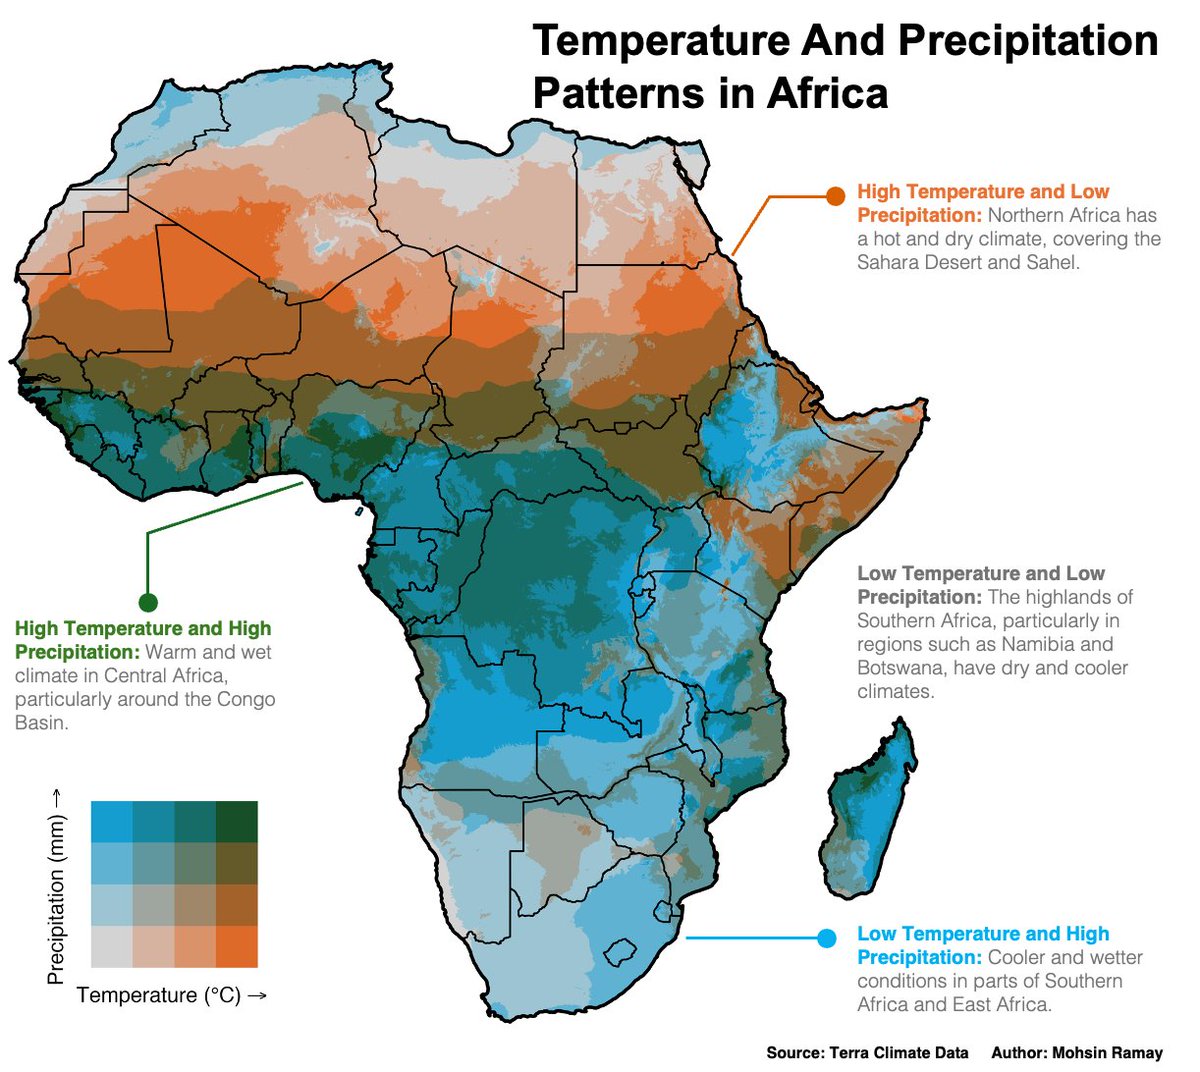
Dynamic, Diverse & Distinctive Climate! Sahara & Sahel: Hot & dry Congo Basin: Warm & wet Namibia & Botswana: Cool & dry East/Southern Africa: Cool & wet This map highlights the continent’s diverse climate zones, crucial for sustainability and agriculture. #Climate #Africa #GIS
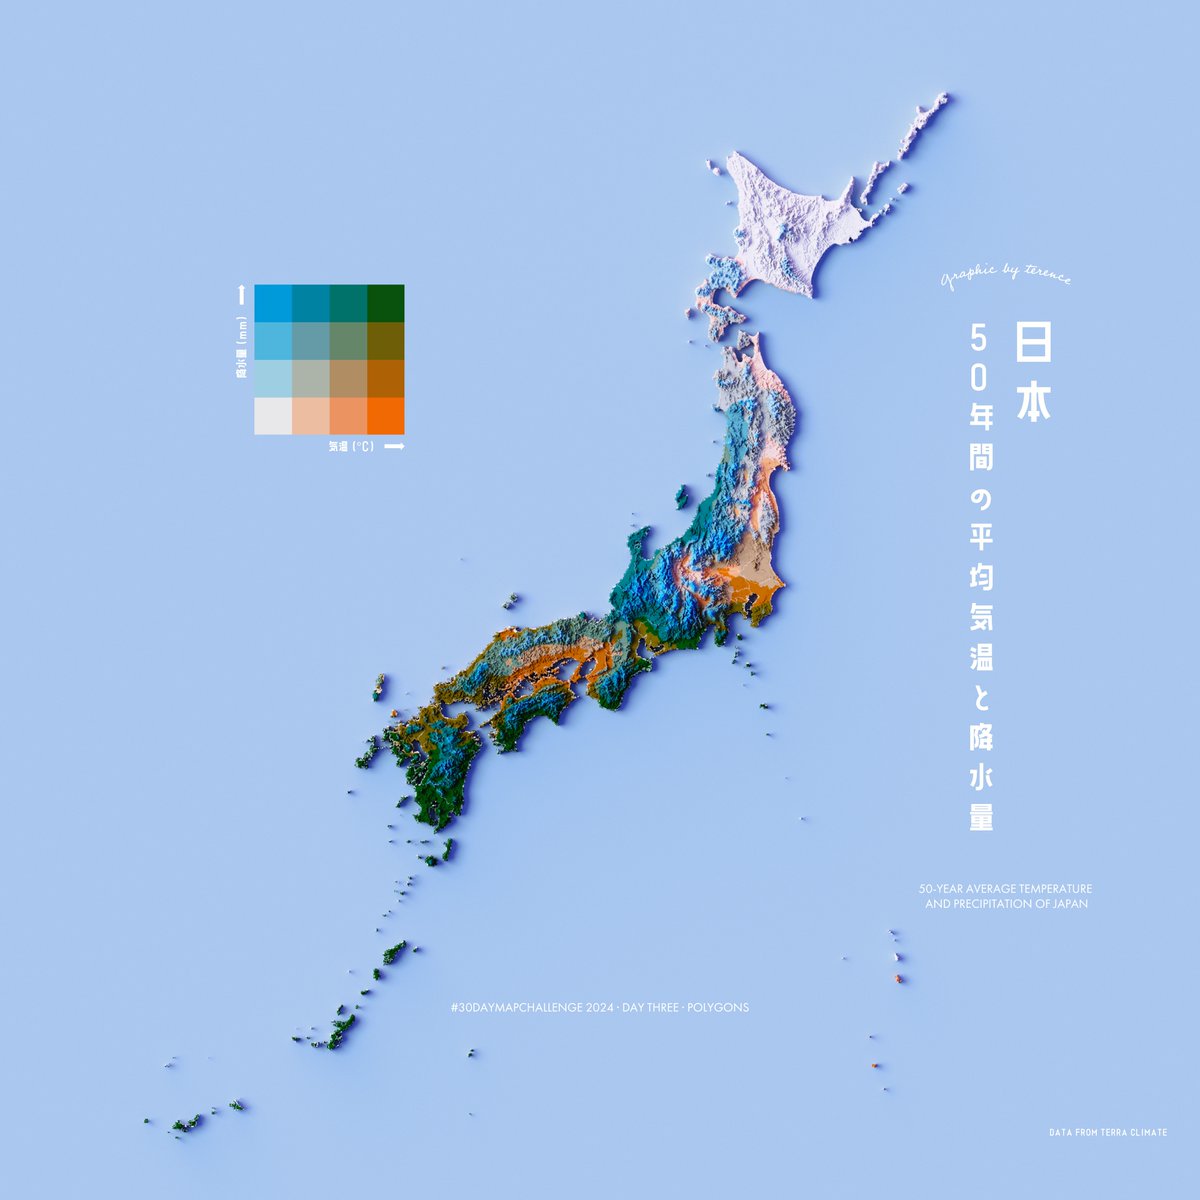
#30DayMapChallenge · Day 3 · Polygons. 50-year average temperature and precipitation of Japan. Inspired and made possible by @mohsinramay_
Monitor the Sulfur Dioxide concentration using Google Earth Engie | Air Quality Monitoring using GEE Tutorial Link: youtube.com/live/KbEt5pzxp… Registration Info: studyhacksgeospatial.com/google-earth-e… Get Started Today – No Prior Coding Required! #AirQuality #EnvironmentalMonitoring

United States Trends
- 1. Cowboys 36,1 B posts
- 2. #WWERaw 30,1 B posts
- 3. Pulisic 4.264 posts
- 4. Cooper Rush N/A
- 5. #AskShadow 4.683 posts
- 6. Mixon 6.734 posts
- 7. #HOUvsDAL 4.007 posts
- 8. #USMNT 1.276 posts
- 9. Tunsil N/A
- 10. Skenes 1.198 posts
- 11. Merrill 6.129 posts
- 12. Sean Duffy 20,8 B posts
- 13. #MNFxESPN N/A
- 14. Rhea 14,4 B posts
- 15. Luis Gil 6.464 posts
- 16. Nico Collins 3.326 posts
- 17. CJ Stroud 1.813 posts
- 18. Cowser 1.755 posts
- 19. Mazi Smith N/A
- 20. GOTY 52,8 B posts
Who to follow
-
 Mariatte Mx.
@mariatteMx -
 Titho Araña
@TithoTed -
 João Ricardo (Moita)
@Biohard -
 Fabio
Fabio
@fabiors777 -
 Jesús M. 🇪🇸 🕊 ✝️
@RallyBadajoz70 -
 Tamara Contador M 🐛
@TamaraContador -
 daniel
@diosesdp -
 EcoYaab
@ecoyaab -
 Elisabetta 🔮
@StregaBettina -
 TipsmejorarDF
@TipsmejorarDF -
 NICOLA ANGELO FAMIGLIETTI
@Nic_Fam -
 Alex ThunderLord
@AlexThunderlord
Something went wrong.
Something went wrong.


