Stock Analysis
@stock_analysisxHighly accurate data on stocks, IPOs, ETFs, and more. Our goal is to be the best free investing website on the internet.
Similar User

@Mason_Jappa

@myfirstmilpod

@tproger

@vivino

@helloitsolly

@TheChartress

@JohnathanBi

@jus10castelli

@GiadaPistilli

@TheMiddleMarket

@Bouazizalex

@PUGStockMarket

@Metaphysic_ai

@maddiehalla

@cooperunion
Our new Stock Comparison tool allows you to compare total return, market cap, revenue and various other metrics: stockanalysis.com/stocks/compare/

Each stock now has a complete downloadable stock price history since the day the stock started trading. stockanalysis.com/stocks/aapl/hi…
Our financials pages now show the fiscal year and quarter in addition to the filing date. They are also much easier to navigate on mobile devices with a sticky header and title column. Example: stockanalysis.com/stocks/nvda/fi…
Apple $AAPL is once again the world's most valuable company after big gains in the past two days following its AI announcements: stockanalysis.com/list/biggest-c…

Yesterday, NVIDIA reached a market cap of 3 trillion and surpassed Apple as the second most valuable company in the US: $NVDA $AAPL stockanalysis.com/list/biggest-c…
Our analyst forecast pages now show the Forward PE ratio for up to 5 years into the future. Example for $MSFT: stockanalysis.com/stocks/msft/fo…
Reddit has filed for an #IPO with the ticker symbol $RDDT. Revenue of 802M with a net loss of 90M in the past 12 months. Detailed financials coming soon: stockanalysis.com/stocks/rddt/
We have added many new indicators to the stock screener in the past months. You can now choose from a total of 217 unique indicators. 💡Pro tip: Use the filter search box. For example, type "dividend" to instantly see all indicators related to dividends. stockanalysis.com/stocks/screene…
Our analyst pages now have charts that show all of an analyst's individual ratings for a stock. Example: stockanalysis.com/analysts/mark-…

We have just launched super advanced charts on the site. They include real-time updates, 120 technical analysis studies and 37 drawings, dark mode option, full screen option and more. #stocks #investing #chart $AAPL stockanalysis.com/stocks/aapl/ch…
New feature: See up to 30 years of revenue history for each stock. Try switching between annual/quarterly/trailing to get a great visualization of the revenue trend over time. #stocks #investing #revenue stockanalysis.com/stocks/aapl/re…

We are working on building employees pages for each stock. You can see current and historical employee counts and the growth over time. stockanalysis.com/stocks/meta/em… We're doing this manually and haven't completed all stocks yet, but let us know if you want us to add any right away.

On Stock Analysis, you can now see a stock's ratings and price targets from individual analysts. Use the star rating to determine whether the analyst is worth taking seriously. It is based on an analyst's accuracy and average return. stockanalysis.com/stocks/aapl/ra…
Sectors and industries are a way to group similar stocks together. There are two main classification systems, which confusingly use opposite terminology. Learn all about them here: stockanalysis.com/term/industry-… #finance #investing #stocks
What's the difference between common stock and preferred stock? Test your knowledge here: stockanalysis.com/term/preferred… #stock #finance #investing
Accounts receivable, or AR, represent money owed to a company for goods and services it has provided to customers but has not yet received payment for: stockanalysis.com/term/accounts-… #accounting #stocks #finance #investing
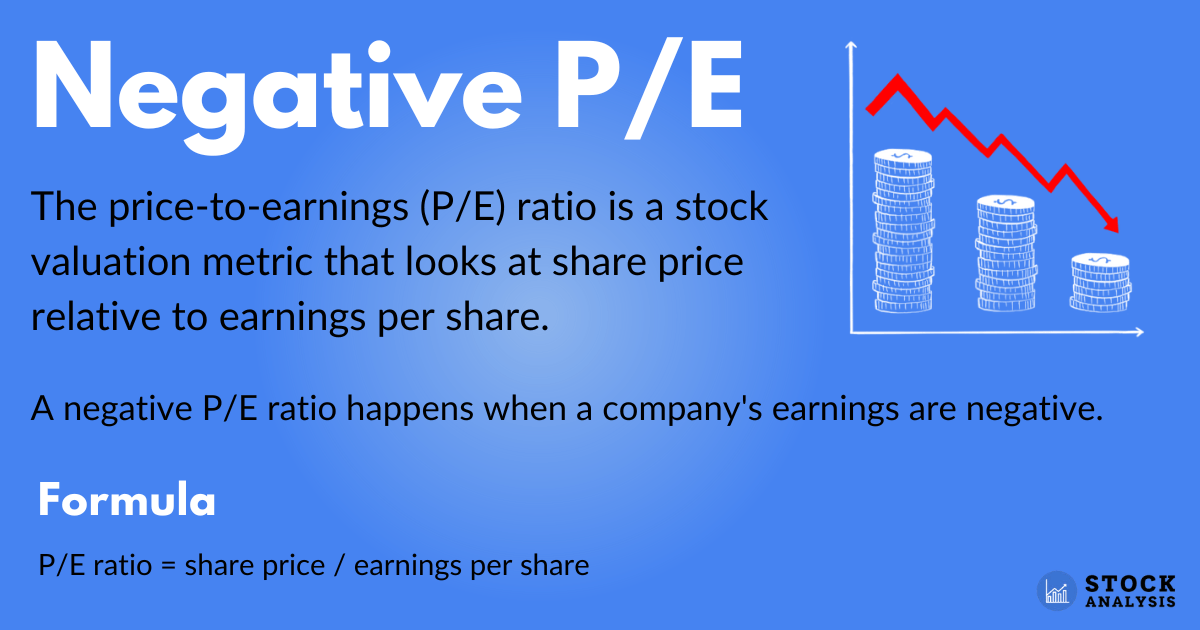
What does a negative price-to-earnings ratio mean? Should you still invest in a stock with a negative P/E? Find out here: stockanalysis.com/article/negati… #finance #investing #stocks

Cash and cash equivalents is a useful number that can help investors understand whether a company is liquid enough to cope with unexpected short-term cash needs. However, it's a balance. Learn all about it here: stockanalysis.com/term/cash-and-… #investing #finance #stocks
When comparing the financial figures of two companies, it’s important to note their reporting periods. Here's why companies might choose to use a fiscal year to report: stockanalysis.com/term/fiscal-ye… #finance #terms #investing
Analyzing a company's PP&E can show investors how the company is managing its capital. Learn all about it in today's article 👉 stockanalysis.com/term/ppe-prope… #assets #finance #ppe #investing
United States Trends
- 1. Ole Miss 20,8 B posts
- 2. Indiana 54,5 B posts
- 3. Jaxson Dart 4.723 posts
- 4. Gators 11,6 B posts
- 5. Ohio State 35,7 B posts
- 6. Lane Kiffin 3.104 posts
- 7. Ryan Day 5.744 posts
- 8. Billy Napier 1.959 posts
- 9. Wayne 132 B posts
- 10. Howard 25,2 B posts
- 11. UMass 5.568 posts
- 12. Buckeyes 11,7 B posts
- 13. Caleb Downs 7.520 posts
- 14. Lagway 5.938 posts
- 15. Gus Johnson 1.609 posts
- 16. Gerard Martin 13,6 B posts
- 17. #iufb 5.822 posts
- 18. Tottenham 95,2 B posts
- 19. Man City 11,6 B posts
- 20. Surgeon General 154 B posts
Who to follow
-
 Mason Jappa
@Mason_Jappa -
 My First Million
@myfirstmilpod -
 Типичный программист
@tproger -
 Vivino
@vivino -
 Olly
Olly
@helloitsolly -
 Abigail Doolittle
@TheChartress -
 Johnathan Bi
@JohnathanBi -
 justincastelli
@jus10castelli -
 Giada Pistilli
@GiadaPistilli -
 Mergers&Acquisitions
@TheMiddleMarket -
 Alex Bouaziz
@Bouazizalex -
 PUG Stock Market Analysis, LLC
@PUGStockMarket -
 Metaphysic.ai
@Metaphysic_ai -
 Maddie Hall
@maddiehalla -
 The Cooper Union
@cooperunion
Something went wrong.
Something went wrong.


