Similar User

@ScarletVizion

@Tangy_54

@Kyriewitherspoo

@vizBrewer

@sharjoshu

@Makwad
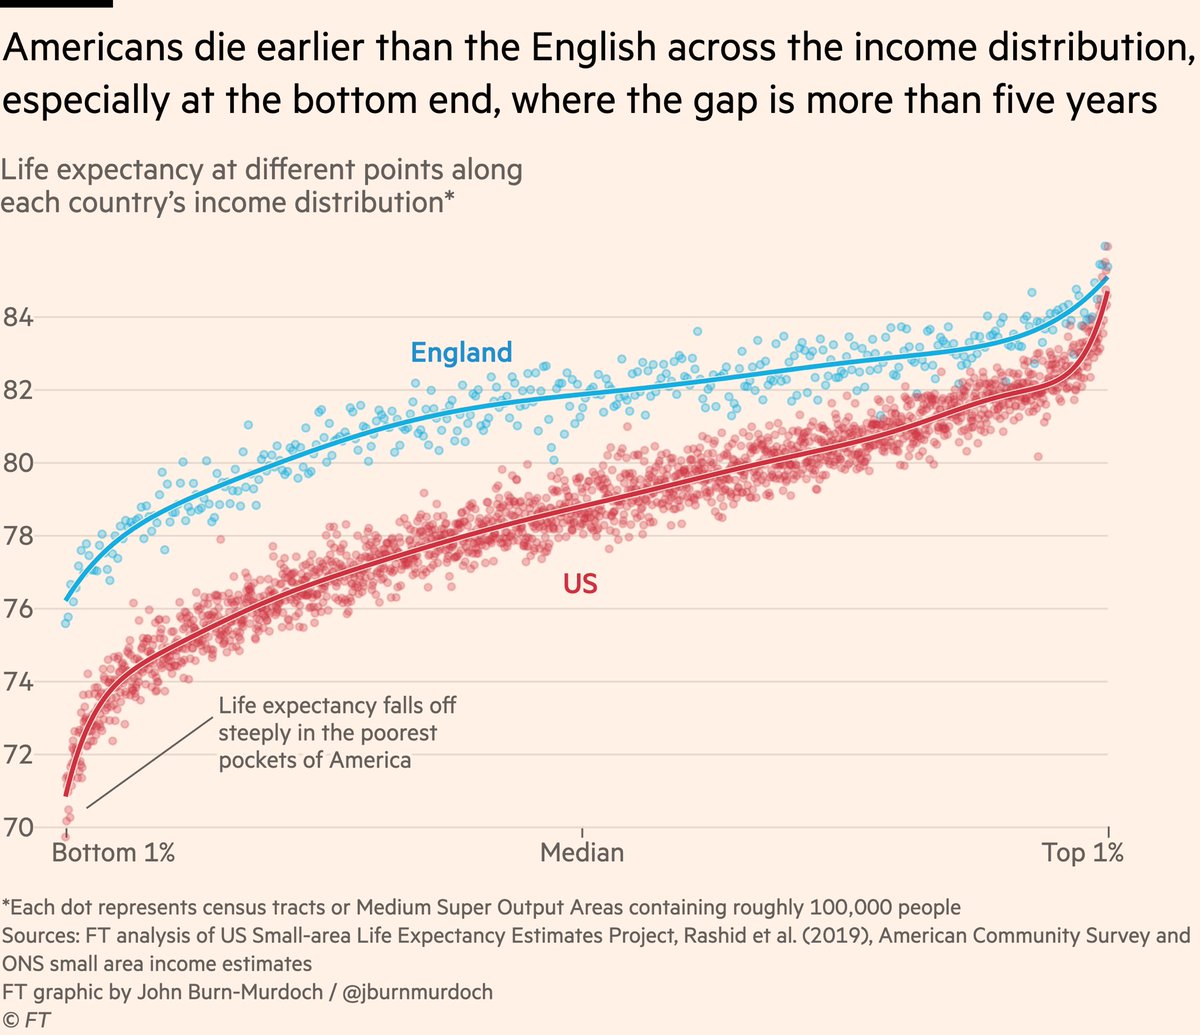
NEW: I’m not sure people fully appreciate how dire the US life expectancy / mortality situation has got. My column: enterprise-sharing.ft.com/redeem/75e5e3d… And some utterly damning charts. 1) at *every* point on the income distribution, Americans live shorter lives than the English.

Built a script today to create a building density map for anywhere in the world using Google #EarthEngine and the @Microsoft Global ML Building Footprints dataset from the GEE Community Catalog. Try out the script on your own region of interest code.earthengine.google.co.in/2c60034b74ad74…

This #VizOfTheDay by Alexander Philipeit tracks the exact position of the sun throughout the day and across different seasons. Pro tip: You can view the solar position by various locations around the world. tabsoft.co/3zpgby9

@KHOU @abc13houston @KPRC2 @FOX26Houston @NBCNews @ABC @CBSNews @CNN @AP y’all did need to report to the public about these scam signs reddit.com/r/houston/comm…
Did you know that you can make Excel files automatically from R? Well you can with this awesome R package called openxlsx. I wrote a tutorial to help you! Article: bit.ly/3CpR2WA #rstats

R is getting better in Production!! I've just added to my cheat sheet: ✅ Production: plumber, targets, renv ✅ EDA: DataExplorer, skimr, correlationfunnel ✅ ML & DL: Torch for R, mlverse Get the updated R cheat sheet here: buff.ly/3lfysr4

Do you like raw hamburger and frozen Gordon fish sticks? #rustykrabexperience #houston #popupbar has you covered. The worst restaurant experience ever. $130 for this.


. @AnyaAHearn and @AllanWalkerIT's beautiful voronoi chart convinced me that there are use cases when it makes sense : public.tableau.com/profile/allan.…
Playing around with #VizAnimations in Tableau 2020.1 beta. Pretty cool! I can see advantages for simpler transitions in making it more obvious to users when they amend a view. Thank you @flerlagekr for the Automated Parliament Chart.
Data Pivoting with tidyr using the new tidyr functions. blog.methodsconsultants.com/posts/data-piv…
Outstanding animated globe shows a year worth of earthquakes by depth (July 2017 to July 2018). In the interactive online version you can click on each individual #earthquake to learn more. Epic #dataviz! Source: buff.ly/353fycg
United States Trends
- 1. #ArcaneSeason2 147 B posts
- 2. #UFCMacau 17,5 B posts
- 3. Jayce 65,4 B posts
- 4. Ekko 60,3 B posts
- 5. Wayne 89,9 B posts
- 6. SEVENTEEN 1,37 Mn posts
- 7. maddie 20,5 B posts
- 8. Jinx 192 B posts
- 9. Good Saturday 21,9 B posts
- 10. Wang Cong 1.084 posts
- 11. Fernandes 7.168 posts
- 12. Ulberg 2.140 posts
- 13. Shi Ming 1.844 posts
- 14. #saturdaymorning 2.897 posts
- 15. #SaturdayVibes 4.263 posts
- 16. woozi 295 B posts
- 17. #jayvik 63,5 B posts
- 18. BIGBANG 415 B posts
- 19. Volkan 3.912 posts
- 20. JUNGKOOK 542 B posts
Something went wrong.
Something went wrong.


