Similar User

@khosodamathedu

@IgedegbeO

@kha_ghaffar

@Pradeep58630321

@MedhaJain01

@DrSudakow

@BRazafindrabe

@Sattwik_007

@MikeChaidez3
Step-by-step guide to write an introduction that engages and convinces your audience of your research's value 👇

Exciting announcement: Our 2025 Course Calendar is here! We’re excited to share the dates for our 2025 courses, designed to enhance your expertise in #Neuroscience, #Climate Science, #Artificial Intelligence, and Machine Learning. 📢Get updates at buff.ly/2SBAfb1

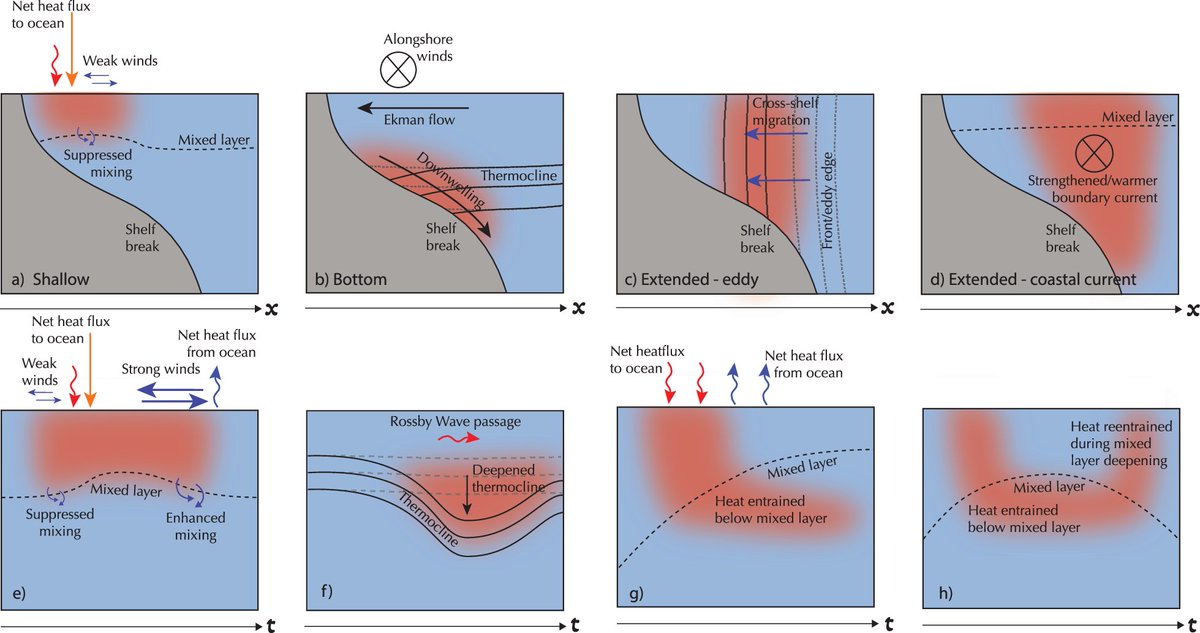
How do we define marine heatwaves? What are the different types, and how do they evolve? What are the impacts and what's in store for the future? Read our new article @CommsEarth A global overview of marine heatwaves: nature.com/articles/s4324…
If you're an "OVERTHINKER," watch this:
What is a Problem Statement ??

We will explore the essentials of Python data science, including its importance, setting up the environment, data manipulation, visualization, and machine learning. pyoflife.com/python-data-sc… #DataScience #statistics #DataScientist #statistics #pythonprogramming #dataviz

This book is not just for statisticians. It’s for any biologist who wants to harness the power of data analysis to fuel their research. pyoflife.com/the-new-statis… #DataScience #statistics #ratats #rprogramming #DataScientists #bioinformatics #machinelearning #DataAnalytics

Survival analysis is a statistical technique used to analyze time-to-event data, such as the time until death or the time until the failure of a machine. pyoflife.com/survival-analy… #DataScience #rstats #DataScientists #statistics #mathematics #DataAnalytics #datavisualizations

Rules of color in Data Visualization

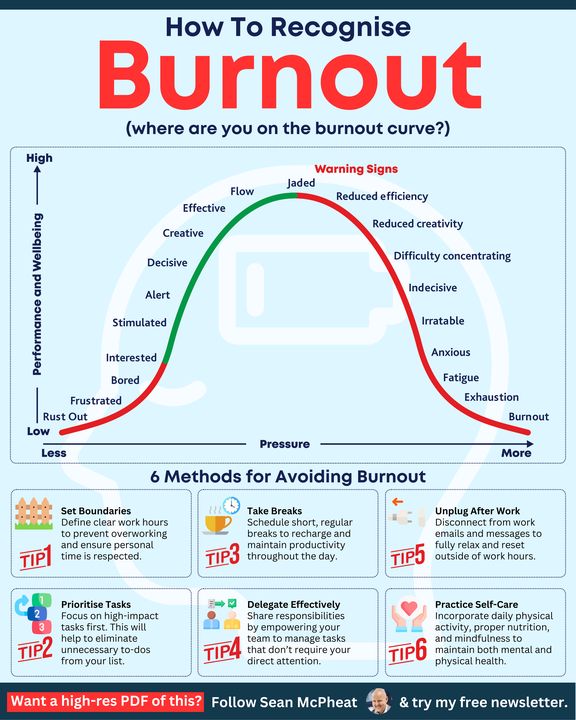
These are 20 key burnout indicators. Where are you on the burnout graph? ⬇️ ♻️ Repost to help others spot the signs of burnout. ➕ Follow me for more content like this.
New research article: The role of refractive indices in measuring mineral dust with high-spectral-resolution infrared satellite sounders: application to the Gobi Desert doi.org/10.5194/acp-24…
Heat maps are a graphical representation of data that uses color coding to show the values of a matrix. pyoflife.com/how-to-create-… #DataScience #rstats #DataScientists #statistics #mathematics #r #programming #datavisualizations

250 Coursera FREE Courses- mltut.com/coursera-free-… @KirkDBorne @antgrasso @ronald_vanloon #MachineLearning #DeepLearning #BigData #Datascience #ML #HealthTech #DataVisualization #ArtificialInteligence #SoftwareEngineering #GenAI #deeplearning #ChatGPT #OpenAI #GPT5 #AI #GPT4…

Top 100 Books You Should Read! #BigData #Analytics #DataScience #IoT #IIoT #PyTorch #Python #RStats #TensorFlow #Java #JavaScript #ReactJS #GoLang #CloudComputing #Serverless #DataScientist #Linux #Books #Programming #Coding #100DaysofCode geni.us/Top-100-Books


Our article on "Exploring the influence of physical and chemical factors on new particle formation in a polluted megacity" (Ali et al., 2024) is now online! @SahirUmer @EnvSciRSC #ESATMOS #OpenAccess pubs.rsc.org/en/content/art…

United States Trends
- 1. #LasVegasGP 232 B posts
- 2. Bama 36,5 B posts
- 3. Auburn N/A
- 4. Lakers 39,5 B posts
- 5. Max Verstappen 113 B posts
- 6. Lewis 105 B posts
- 7. Sainz 40 B posts
- 8. UCLA 10,5 B posts
- 9. Lando 36,1 B posts
- 10. Chuck Woolery 4.578 posts
- 11. Ferrari 60,6 B posts
- 12. LAFC 3.602 posts
- 13. Nuggets 30,8 B posts
- 14. Oklahoma 48,8 B posts
- 15. Jokic 20,7 B posts
- 16. Love Connection 4.824 posts
- 17. George Russell 26,6 B posts
- 18. Texas 148 B posts
- 19. Milroe 17,2 B posts
- 20. Sounders 1.518 posts
Something went wrong.
Something went wrong.


