
Olga
@OlgaTsubiksTweets about #datascience, #analytics, #dataviz and all things #data. Founder of #dataforacause
Similar User

@acrahen

@bibleviz

@MissLaura203

@sophie_sparkes

@sezbee

@PabloLGomez
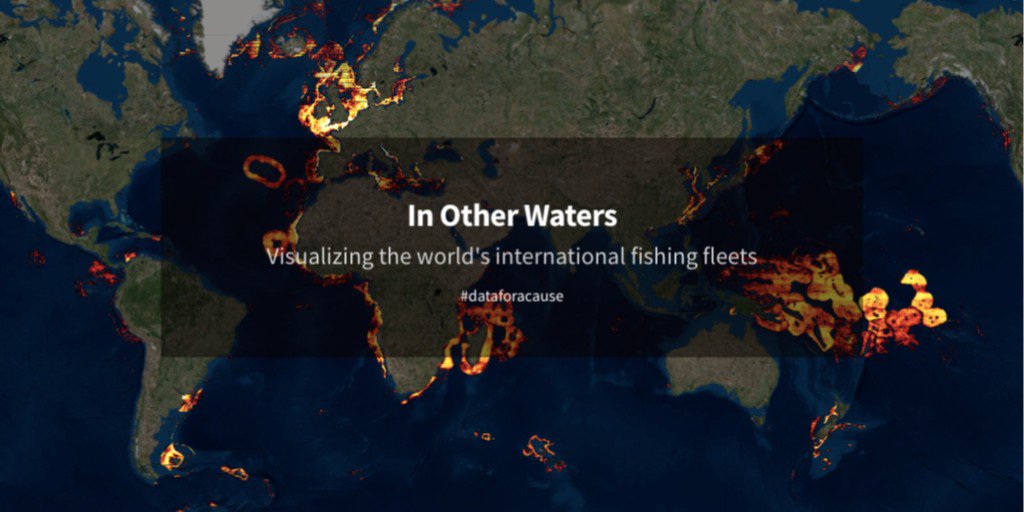
In November 2019, Women in Big Data Toronto chapter hosted its latest speaker series, “Big Data, Big Change.” In my presentation I shared about Data for a Cause and our recent work for @GlobalFishWatch on visualizing global fishing activity. #dataforacause womeninbigdata.org/2019/12/20/wib…
Every day the equivalent of a #plastic bottle pile half the size of the Eiffel Tower in Paris is sold around the world. @SimonScarr & @TmarcoH for @ReutersGraphics show us the truth behind our addiction to plastic: ow.ly/F1Od50w5vRj

How to create network visualization guide in #Tableau🕸 Check out the blog story from @thedatasurfers: ow.ly/1cqr50vT3TC

Using Python/Pandas and Florish? @duncangeere used these tools to create his winning #DataForACause visualization🌍 ow.ly/f9d250vFlIg #datafam
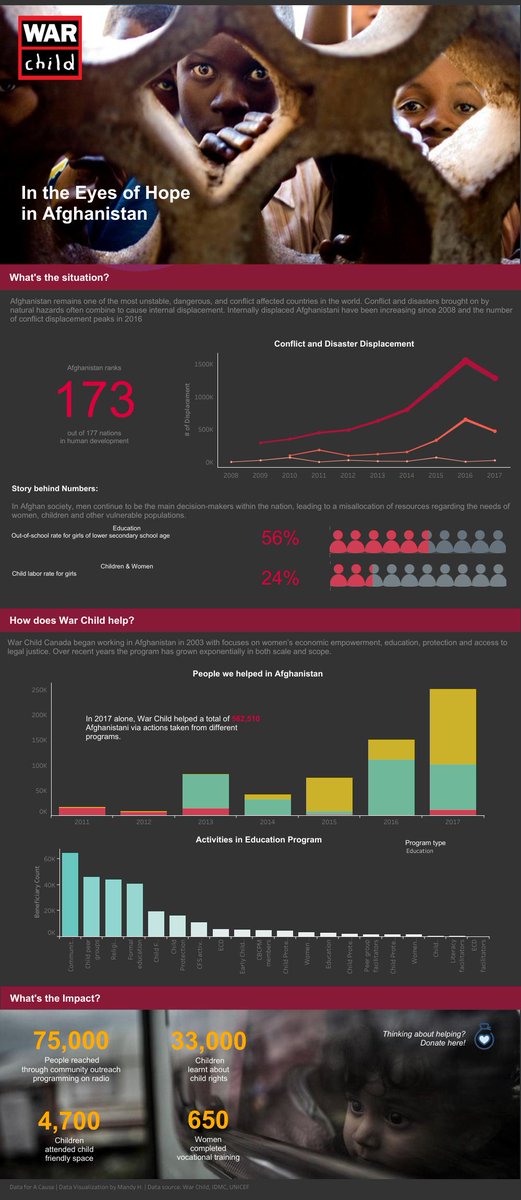
On the occasion of the #InternationalYouthDay, we remind you of the challenge with @WarChildCan👦👧 #DataForACause participants used their skills and talent to visualize War Child's efforts in protecting children and families: pos.li/2czy8o #datavisualization
Here is a nice and simple tutorial on drawing tally charts in Tableau. Do enjoy! 😉🤳tiny.cc/5222az #datavisualization #dataviz #informationdesign

🌊🌊🌊 Since at least the start of the 20th century, the average global #sea level has been rising. A serious issue related to #globalwarming. Check my new #dataviz to visualize how the #sealevel changed since 1993. >> tabsoft.co/2ZHUpSE

Could you take a moment to fill in this typeform? We are interested in what websites and blogs on data visualization you read. It shouldn't take more than 1 minute to complete. Thank you!💛 dataforacause.typeform.com/to/lVTr6r #datavisualizationblog

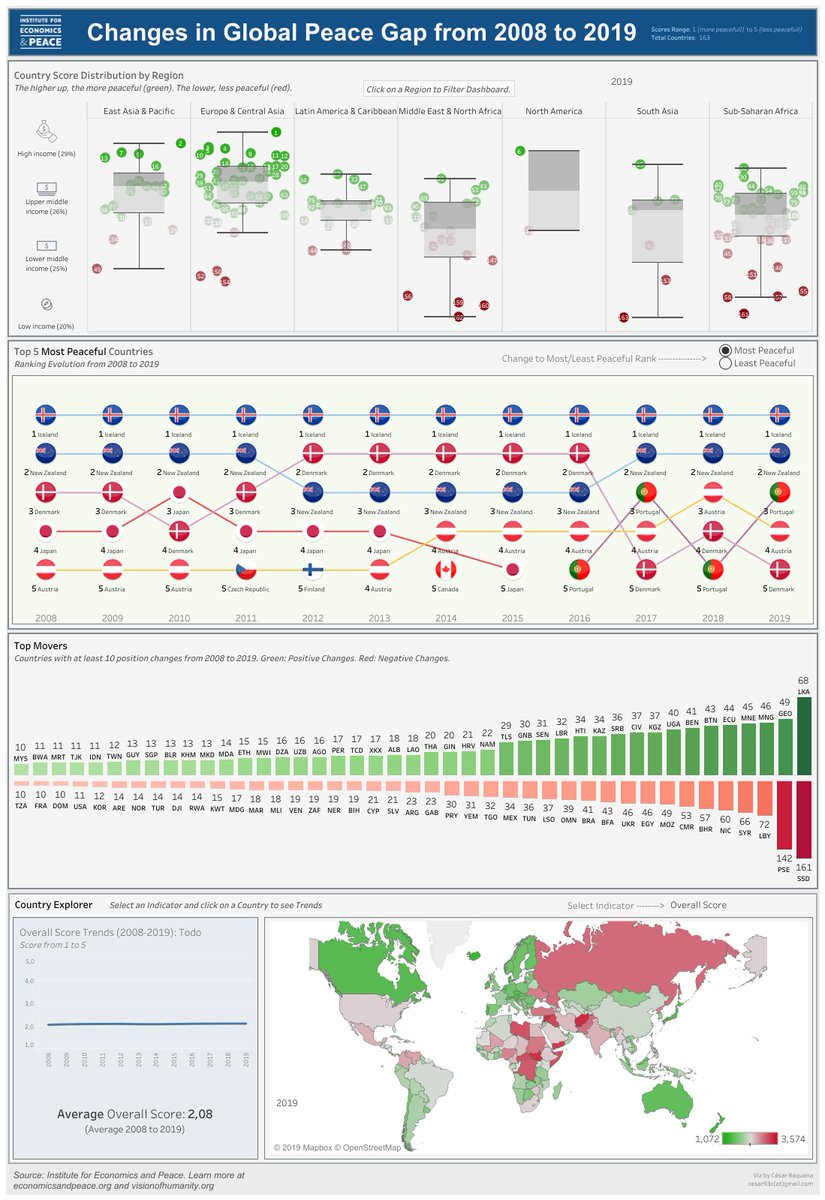
The Institute for Economics and Peace (@GlobPeaceIndex) posted a blog story about the winners of the 2019 Data For A Cause Challenge — Visualizing Global Peace Gap🕊Save to read! tiny.cc/4si88y #visionofhumanity
We are pleased to announce the winners of the 2019 @dataforacause challenge! 🥇@AndSzesztai 🥈@enazander 🥉@ingrid_arreola visionofhumanity.org/data/winners-o…
Congratulations @ingrid_arreola (USA), the 3rd place winner of the 16th #DataForACause challenge!🥳💐 Check out the winner's full #datavisualization and share your thoughts in comments: tiny.cc/gez68y
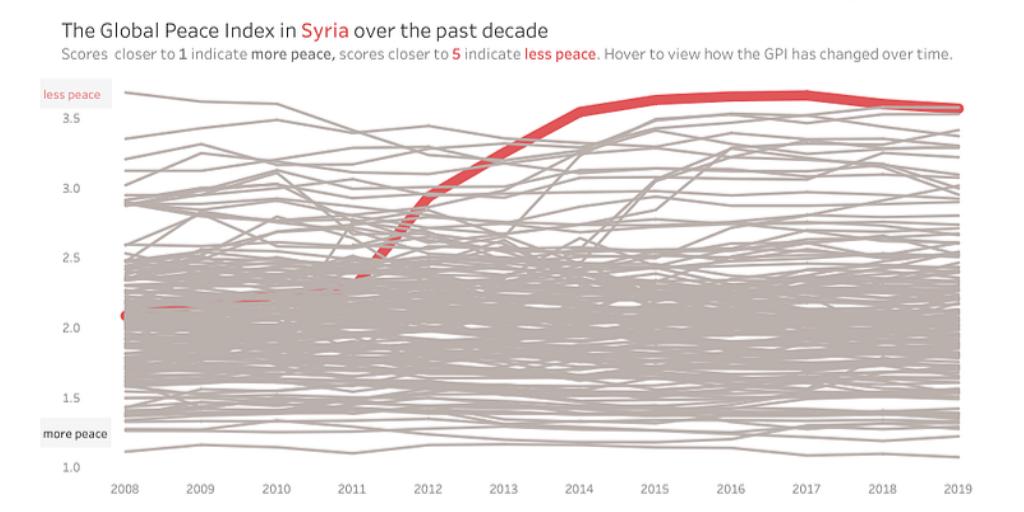
Congratulations @enazander (Finland), the 2d place winner of the 16th #DataForACause challenge!👏🦉 Check out the winner's full #datavisualization and share your thoughts in comments: tiny.cc/gez68y
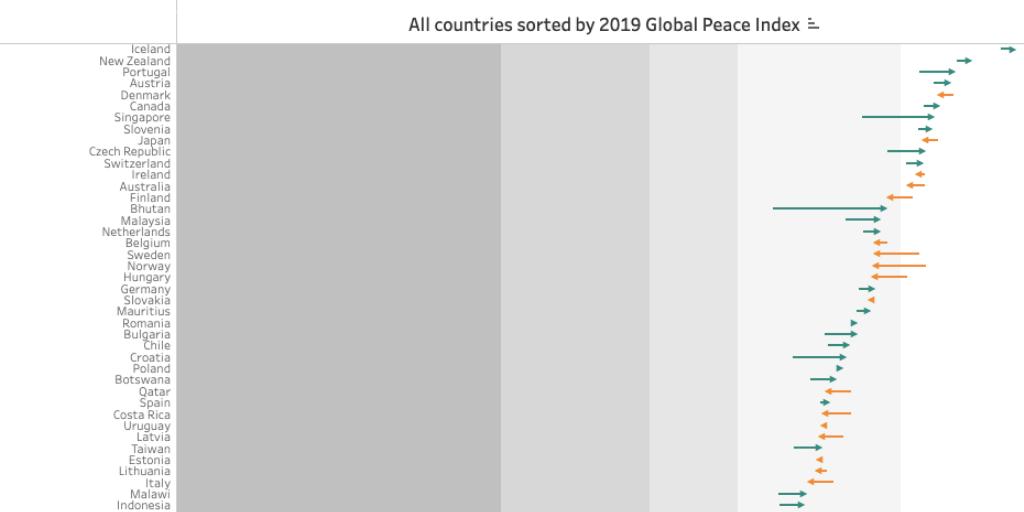
Meet @AndSzesztai (The Netherlands), the 1st place winner of the 16th #DataForACause challenge!🤗🥇 Check out the winner's full #datavisualization and share your thoughts in comments: tiny.cc/gez68y

Meet @LucaUrzi (Italy), a Special Mention of the 16th #DataForACause challenge!🥰🌿 Check out the participant's full #datavisualization and share your thoughts in comments: tiny.cc/gez68y
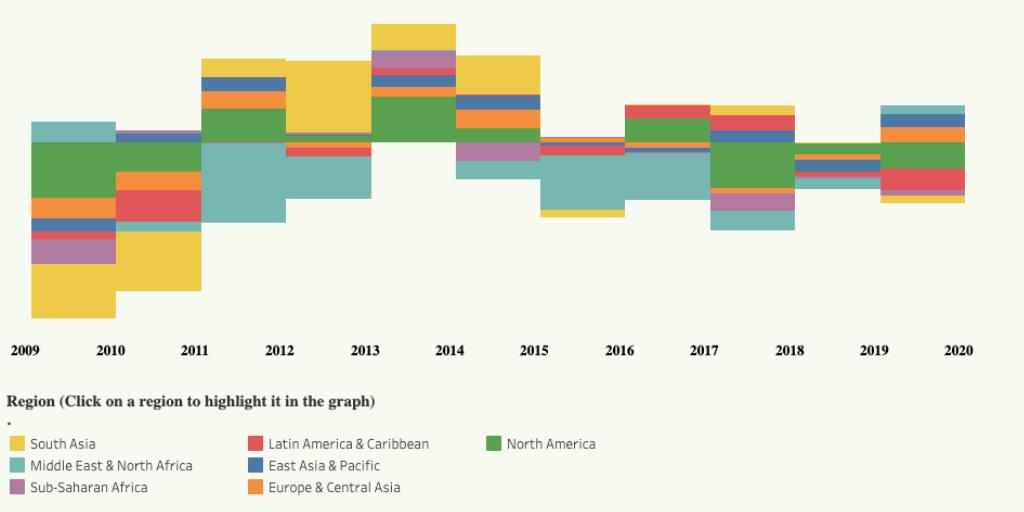
The finalists of the 16th #DataForACause challenge are chosen!🤗 These are 13 participants out of 185 entries from all over the world, including Germany, Netherlands, Australia, USA, Argentina, Finland, Singapore. Stay tuned for further information about the winners #dataviz

For the third consecutive year, the data from the Global Peace Index has been the focus of the @dataforacause competition. Our research fellows are currently selecting the winners to be published on our website visionofhumanity.org #dataviz #dataforacause
The State of Global Peace Gap 🧐 🌎 🌍 🌏 ▸▸▸ boringbarchart.com/global-peace-g… #dataforacause @GlobPeaceIndex Thank you for the challenge @OlgaTsubiks, it has been a lot of fun working with the data! 🙂 @d3js_org #DataViz
Really enjoyed engaging with the #dataforacause challenge. I did my best to look at the Global Peace Gap, 3 domains in peace, and incorporating storytelling. Thanks @dataforacause and @GlobPeaceIndex! View details here: public.tableau.com/profile/ingrid…


I have analysed the Global Peace Index for multiple countries by Metric and Year using tableau and my visualisation can be viewed at: public.tableau.com/profile/beshar… #DataForACause
#dataforacause Visualizing Global Peace Gap! @OlgaTsubiks public.tableau.com/profile/c.sar5…
United States Trends
- 1. Kash 656 B posts
- 2. #FayeYokoYentertainAwards 101 B posts
- 3. SPOTLIGHT COUPLE FAYEYOKO 103 B posts
- 4. Texas 181 B posts
- 5. Houston 32,3 B posts
- 6. Iowa State 10,2 B posts
- 7. #HookEm 15,5 B posts
- 8. #LAGalaxy 2.027 posts
- 9. #BYUFootball 1.058 posts
- 10. Fauna 87,6 B posts
- 11. McCabe 40,2 B posts
- 12. Wray 54,2 B posts
- 13. #Toonami 2.726 posts
- 14. Junior Bergen N/A
- 15. Elko 3.391 posts
- 16. Happy New Month 99 B posts
- 17. Big 12 29,7 B posts
- 18. Oregon 36,5 B posts
- 19. MLS Cup 4.143 posts
- 20. Klein 11,9 B posts
Something went wrong.
Something went wrong.


